IS428 2016-17 Term1 Assign1 Audrey Jee Zhi Ying
Contents
Abstract
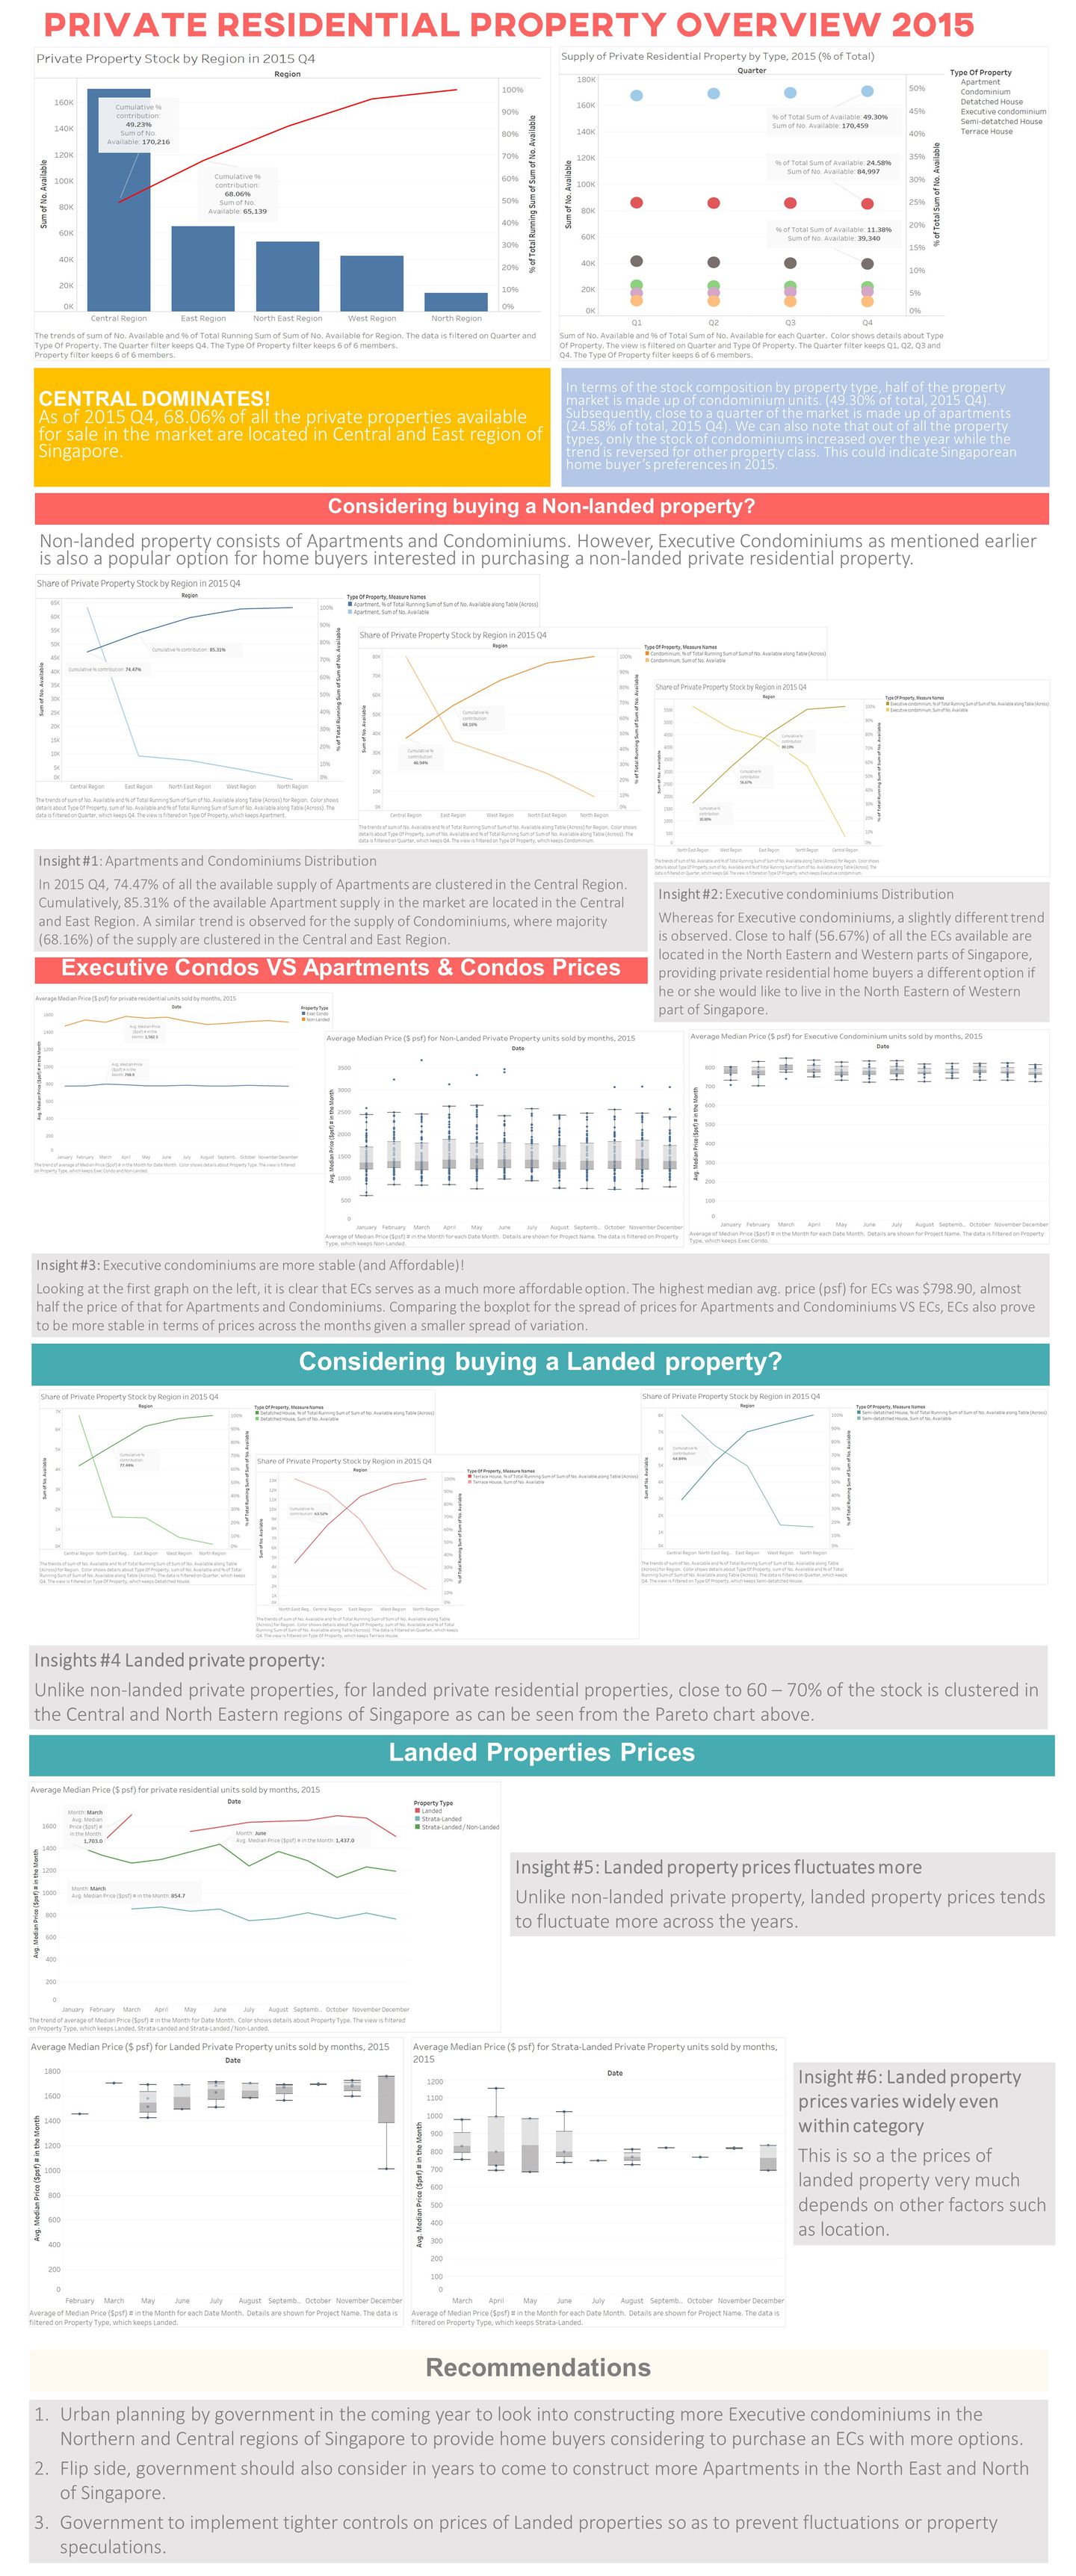
This project aims to look into the trends of the private residential property market in Singapore during 2015. To better understand the market, I would be looking into the supply of private residential properties as well as property prices, with hopes to discover market insights that maybe useful for making policy decisions in 2016.
Problem and Motivation
This project will look at the patterns of the share of private residential property supply in 2015 as well as the distribution of private property price in 2015. From these various insights discovered, this project aims to provide 3 policy recommendations for decision makers implementing policy changes for 2016.
Data Collection
For this project, data from the Urban Redevelopment Authority (URA) is used, for the period of 2015. In terms of supply of private residential property, we would be looking at the stock available by both planning region and planning area. Stock in this case is refers to completed units or space, whether occupied or unoccupied, that is available for physical occupation, according to the URA. In addition, property prices would be examined in this project as well. Point to note is that considering Executive Condominiums (ECs) would be examined in this study despite it being a Public-Private hybrid property. The reason for looking into ECs in this project is because in 2015, Prime Minister Lee announced an increase of income ceiling for ECs from $12,000 to $14,000. This housing policy change has allowed more couples and families who earned too much to purchase a Build to Order flat to purchase ECs as an option, as opposed to paying for Private property. Hence, it would be interesting to look into ECs as well.
Data Preparation
- Property stock data is downloaded from URA's website as csv files, by Quarter.
- The files were then merged to form a consolidated file.
- Property price data is downloaded from URA's website as csv files, by Month.
- The files were then merged to form a consolidated file.
Tools
To clean up and manipulate the data extracted from URA’s website, Excel is used. Excel is selected as a tool because the raw data extracted is not large in size and does not require much manipulation or advance computation, hence Excel provides sufficiently. Whereas for data visualization, Tableau 10 is used because it is compatible with the data set extracted and it allows for insights to be discovered instantaneous, in a visually appealing and interactive manner.
