IS428 2016-17 Term1 Assign1 Albert Bingei
Abstract
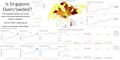
Caption1

The project aims to give a better understanding of the private residential property market in Singapore. Key takeaways of the prior research are that while the population is increasing, the supply of housing increase at a faster rate, making the prices fall in the short term for 2016 and consequently rise in the future. The key trends are that non-landed property supply in the central and northeast areas are increasing the fastest and that general house prices for both landed and non-landed will fall in 2016. The key recommendations will then broadly be centered on accelerated development of the non-landed properties in the East side of Singapore and raising prices of properties in the central area to avoid overcrowding.
Problem and Motivation
In short, the problem facing Singapore in 2016 is the issue of overcrowding and a mismatch of housing demand and supply. This issue is relevant today as sentiments of overcrowding are felt during the daily lives of Singapore residents. These include squeezing into public transport during peak hours to go to work and go home from work, as well as traffic jams in the expressways, reported across all areas in Singapore. The population density map can help us look for some insights, but the spread and distribution of residential housing can also guide us to make better policies to avoid congestion in the future.
The main variables involved are the number of housing units supplied across all the different types of private residential properties, the price range and property price indices and also the years and quarters where the data is available.
Key development questions include: 1) what is the demand of the housing in 2015? Can population spread or population growth be used as a proxy for demand? This is because number of units sold is not a good proxy for housing demand (it is more of a derived demand) 2) How far does the supply match the demand? Or is it a derived demand? 3) How can we use the above information to craft good housing policies for the future? What trends are out there right now in the housing market across the years that justify a certain policy or action?
Thus the policy will be centered on solving these issues, and the infographic aims to solve exactly that.
Approaches
To address the data gathering process, the first stop would be the timeseries data on REALIS. Data pertaining to the individual house type, regardless landed or non landed (ie: Condominiums and apartments, detached house, semi-detached house and terrace house for landed
We acknowledge that the REALIS data itself is not sufficient to justify the policies. Hence a topological map that includes the population numbers in the regions is displayed to enhance the REALIS data.
Tools Utilized
Tableau, Microsoft Excel and Microsoft Powerpoint are the key technologies used. Microsoft OneNote is also used for screen-grab of the external map graphic.
Results
After creating the infographic. The following key recommendations are to accelerated development of the non-landed properties in the East side of Singapore and raising prices of properties in the central area to avoid overcrowding.