IS428 2016-17 Term1 Assign1 Aaron Mak Kang Sheng
Contents
Abstract
According to the price index for residential housing in Singapore, prices have fallen for the first time in the past 5 years. This is mostly due to cooling measures but when is the right time to lift these cooling measures? And how should we do it?
The data points to a decreasing demand and supply for private housing. Now that we know it is a problem, we can think of demand and supply side policies to avert a potential housing market crash.
The policies suggested include refining the buyer stamp duty, increasing the amount that can be loaned and giving grants or better financing methods for property developers.
Problem and Motivation
Recent cooling measures have caused private housing prices to stop rising. However, when is the right time to release these cooling measures? And how should we do it?
To tackle this problem, I’ll be looking at both the demand side and supply side trends over the past few years and come to a conclusion after a thorough review of the current cooling measures.
Approach
Data Collection
REALIS database of past projects and transactions.
Data Preparation
- Data is converted to csv files of 1000 rows each due to the download limit.
- Using a script, awk 'FNR==1 && NR!=1{next;}{print}' *.csv > master.csv , the csv files were merged.
Used QGIS for data preparation of cholorpleth map.
Tools
- Tableau - Data Visualization and Preparation
- QGIS - Data Preparation
- iTerm2 (Terminal App) - Data Preparation
Results
Problem Statement
The main question that I’d like to answer is:
When is the right time to lift the cooling measures? And how should we do it?
In order to answer this question, I’d first have to take a look at what is causing the price drop in 2015 by looking at supply and demand of private housing. To make sure that this trend is part of a longer term problem, I’d also look into the overall trend from 2012-2015 of demand and supply.
Details
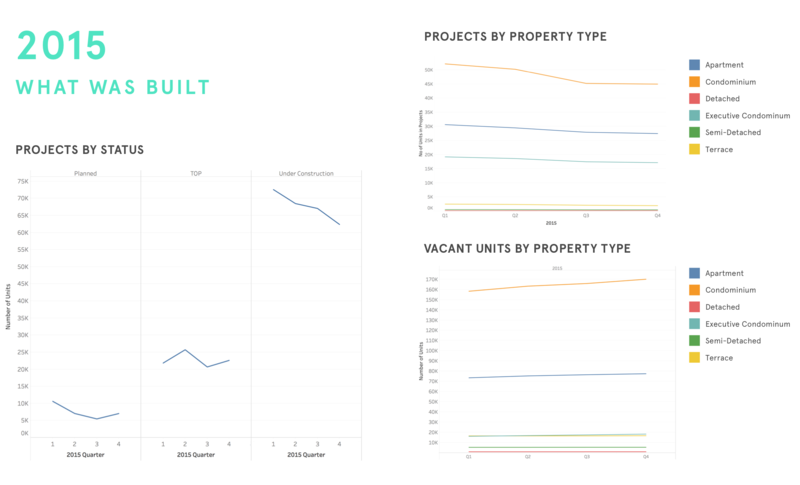
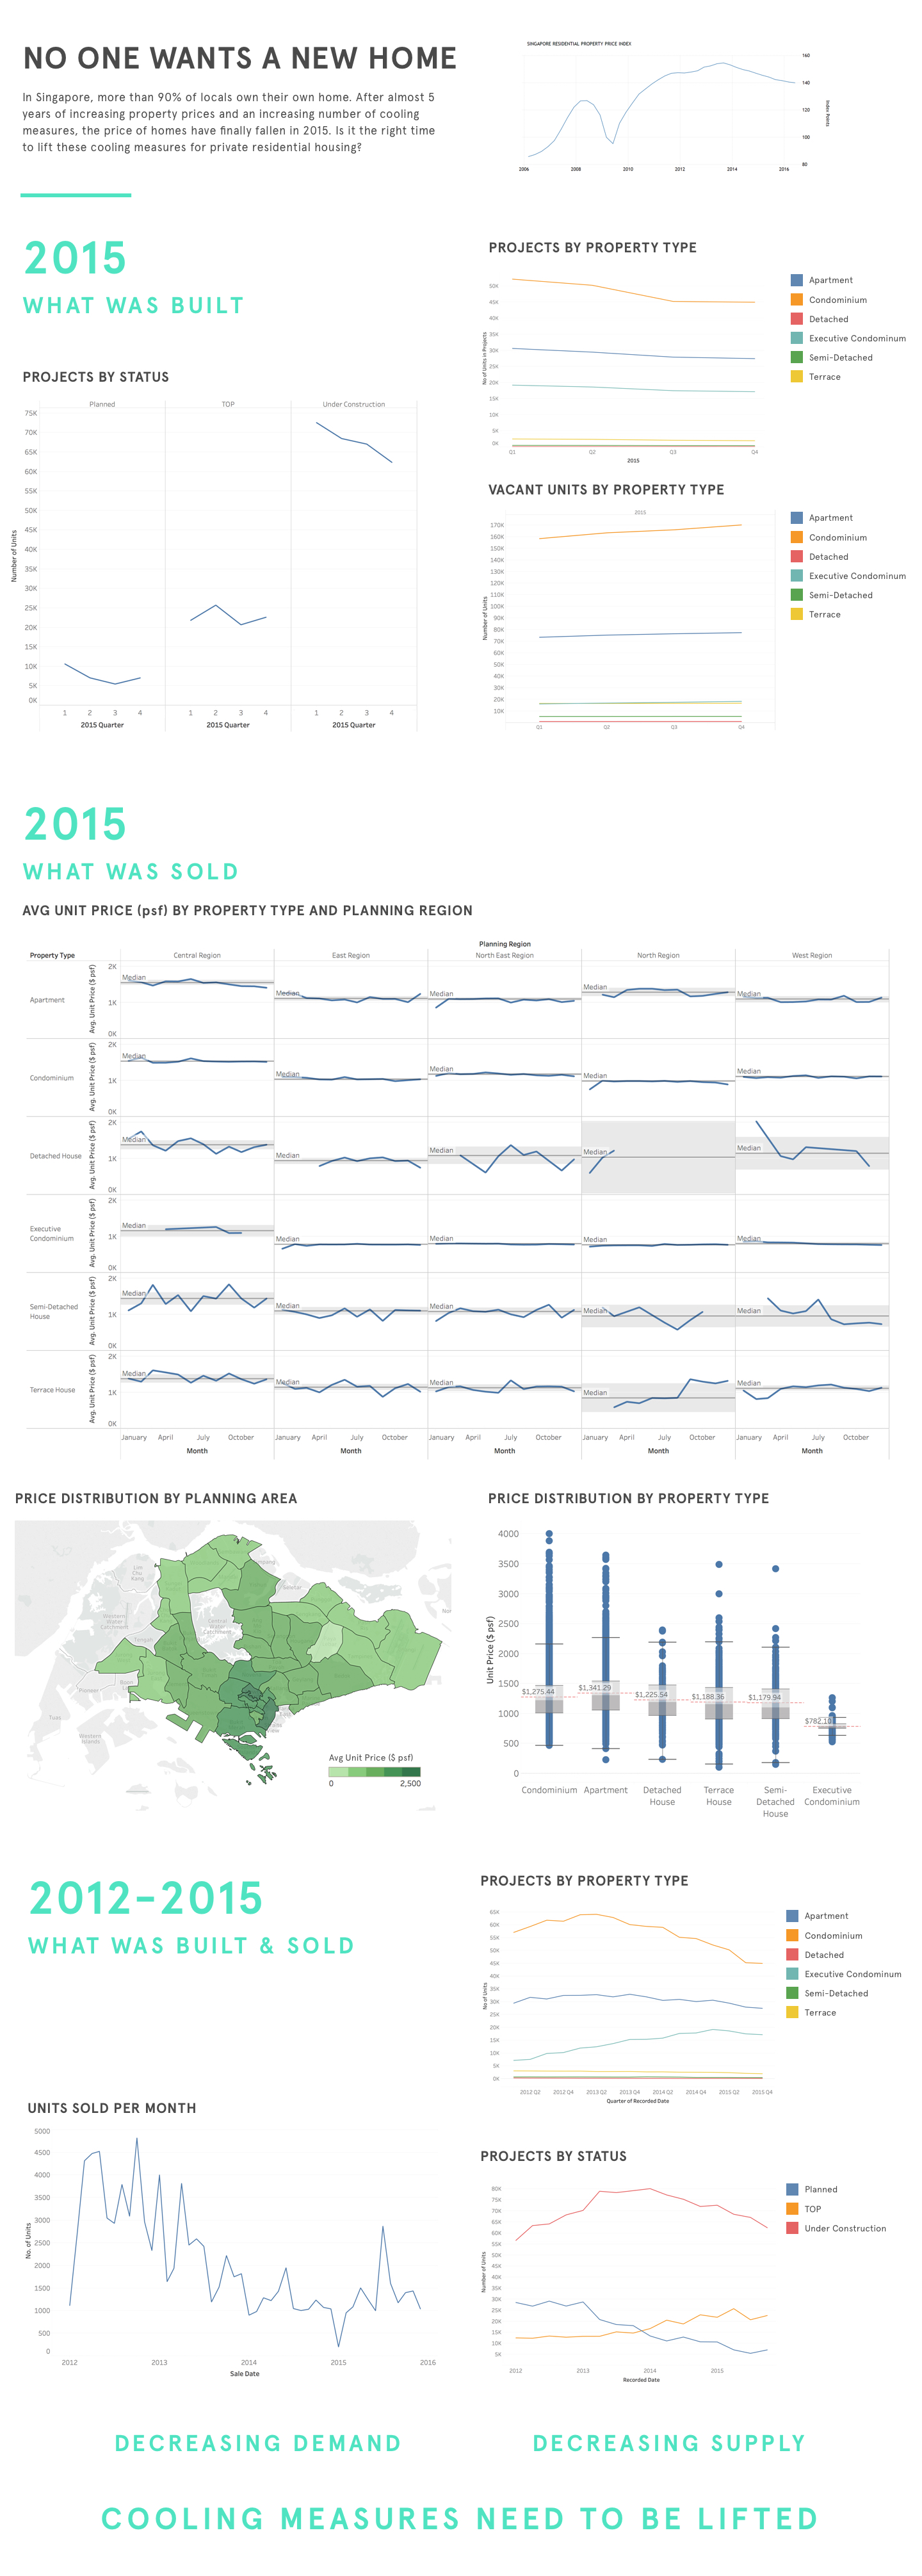
For the supply side, I wanted to emphaisize the decreasing supply in the housing market in 2015. Consequently, I've used line graphs to show the trend over time. I’ve also used distinct but not distracting colours in the graphs to show the different categorical variables.
By colouring the section headers and conclusion a different colour, I can draw attention to it so the viewer will be able to follow the story I’m trying to tell.
You should be able to tell that there is a steep drop in projects under construction in 2015. In addition, there were very few units planned for construction.
In “Projects by Property Type”, there is a general drop in projects across all property types, with condominiums being the most obvious.
“Vacant Units by Property Type” does not show what is being built but it shows that there is an increasing amount of empty units despite a decreasing supply. This shows that the drop in supply is not fast enough to curb the decreasing demand.
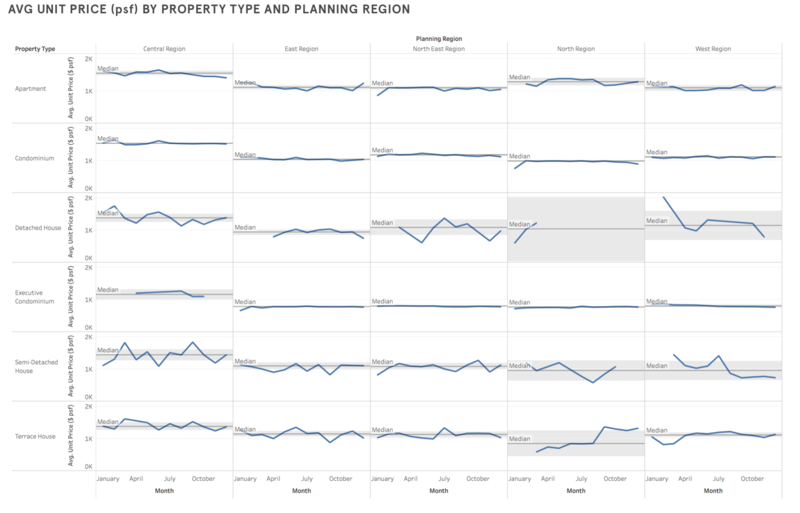
For the demand side, I wanted to show how the prices of houses seem to be stagnant throughout 2015, whether in any area or property type. So I’ve used a series of line graphs to show this trend. The median line and 95% confidence interval shades are to show that the prices do not deviate much throughout the year for most categories.
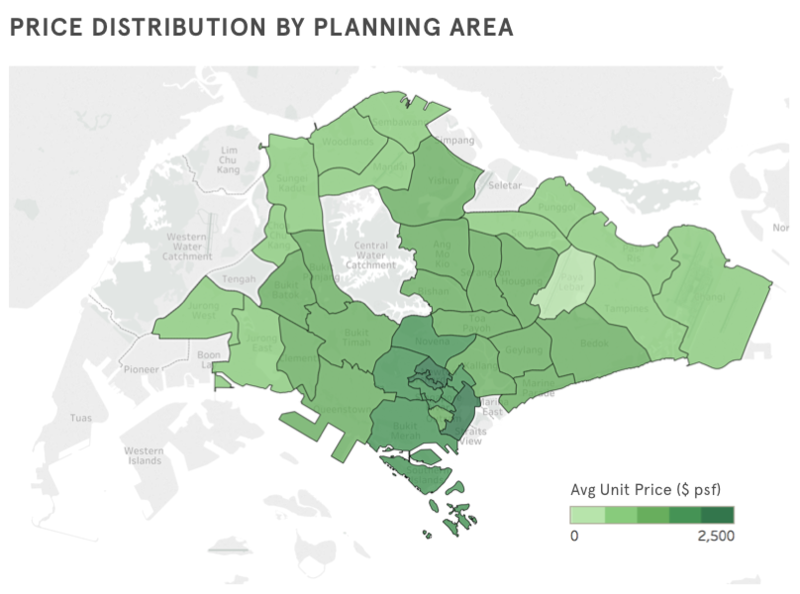
For the price distribution by planning area, I wanted to show the concentration of high priced private housing in the central area. I’ve also used a translucent shade to allow the viewer to see the planning area. I was hindered by the inability of Tableau to display labels on polygons so this is a trade off.
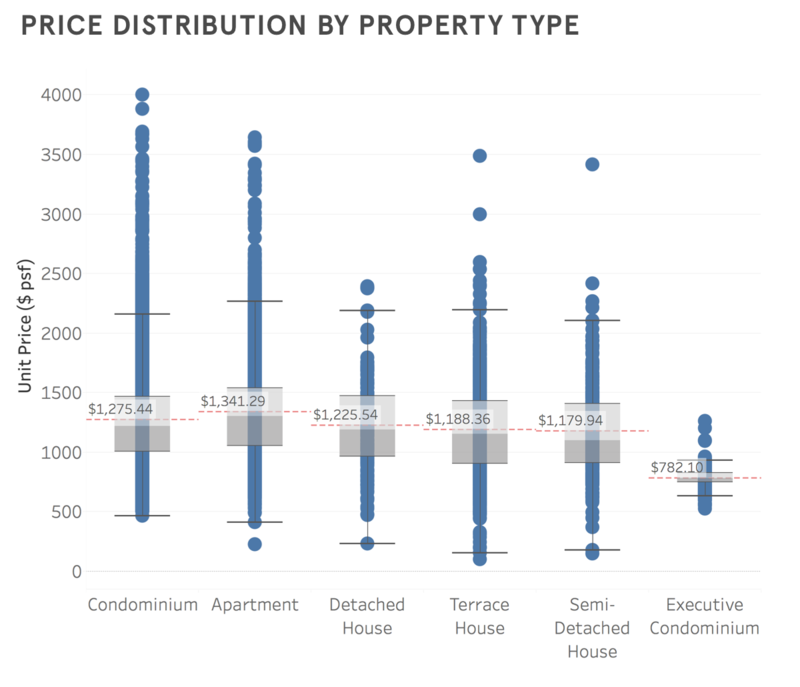
Using a box plot helps the viewer to see the distribution of the prices for each property type. I’ve also added a reference line to display the average and used a dotted red line for clarity. The variance is largest for condominiums and smallest for executive condominiums. Parents also have the highest $ psf while executive condominiums have the lowest $ psf.
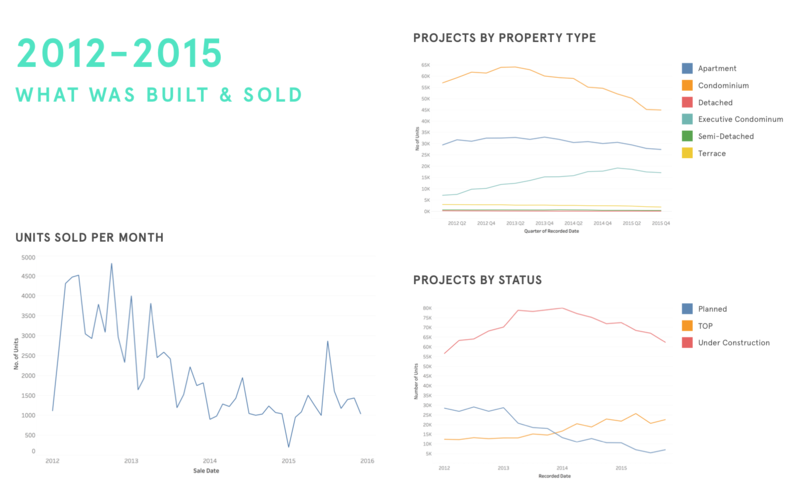
Using line graphs help the viewer to easily visualise the trends over time. It is clear that demand has been decreasing over the years with a clear trend of units sold per month decreasing. Similarly, for projects either by property type or status, we can see that the number of new projects are decreasing, which would lead to decreasing supply. More specifically, the number of condominiums and apartments are decreasing but the number of executive condominiums are increasing. Looking at the projects by status, the number of planned units have decreased to 5000 and those under construction have decreased rapidly as well. Units that are getting TOP in 2015 are the after effects of the large amount of units being constructed in earlier years from 2012-2014.
Full Infographic
Conclusion
From the data, we see that the number of private houses sold has been dropping steadily since 2012. This could explain a fall in demand over the years. In addition, the number of projects have been decreasing, while the number of units under construction has been decreasing. In the immediate future, the vacant private property would increase since the reaction to the drop in demand will be slow. Once projects have started, it is unlikely to be abandoned. In the short term, there will be an over supply of houses since demand has dropped and it will take a few years for the drop in new projects to affect supply, possibly resulting in a further drop in prices. Therefore, the government should attempt to increase demand by lifting some cooling measures.
Now we know that the cooling measures need to be lifted, what is the best way to do so?
Let us look at the past cooling measures.
Cooling measures between 2006-2013:
- Prohibiting developers from allowing purchasers to defer stamp duty and interest payments to a later date
- Prohibition of interest-only housing loans
- Seller stamp duty
- Loan-to-value ratio limits
- Additional buyer stamp duty
- Tenor restriction limit
- Three-year waiting period before new SPRs are eligible to purchase resale HDB flats
- Mortgage service ratio limit
- Total debt service ratio limit
Looking at the cooling measures put in place, there are a couple of things that we could do. We could either refine current policies or add new ones.
A quick way to encourage more demand is to reduce the additional buyer stamp duty. Foreigners and non-individuals face a hefty 15% stamp duty and this heavily discourages them to purchase private property. Looking at the distribution of price by planning area, buyer stamp duties could be reduced for 'unpopular' areas that are furthest from the central region.
Another way is to encourage demand is to allow buyers to borrow more to purchase a house. Currently, it is set at 60% of his gross income. With the ability to borrow more, potential buyers will be encouraged to purchase a private property rather than a HDB one.
Since supply is predicted to be reduced, we can incentivise property developers with grants and additional financing.
By implementing such policies, we are likely to avert a housing market crash.
