Group08 proposal
|
Project name |
|
|
|
|
Contents
PROBLEM & MOTIVATION
Problem
As a buyer looking for flats in matured estates, or Resale HDB flats, it can be difficult to make a decision on your dream home due to the lack of information in the market and the tools to make comparisons. This problem is amplified further by buyers' complete lack of knowledge to decide if a price is good compared to the market average.
Motivation
According to Ms. Christine Sun, head of research and consultancy at OrangeTee, demand for HDB resale flats has been strengthening. Our group feels that with the increasing demand for HDB resale flats and the lack of information and tools in this area, there is a strong need for us to address the issue.
DATASET
| Data/Source | Variables/Description | Methodology |
|---|---|---|
Taken from Data.gov.sg |
|
asd |
BACKGROUND SURVEY OF RELATED WORK
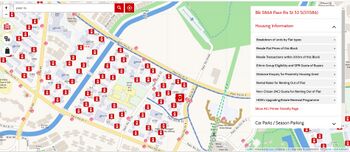
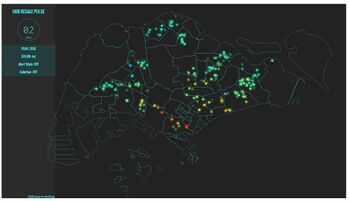
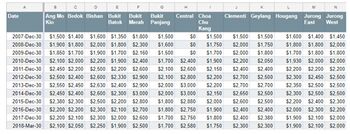
In order for our group to design a new visualisation, it was important to us that we understand the current work out there in the field. This will enable us to make informed decisions on developing our own visualisations. We can also learn from the current visualisations to ensure that our own work adds value and to not repeat any mistakes made. Listed below are screenshots of visualisations and their learning points respectively.
| Reference of Other Interactive Visualization | Learning Points |
|---|---|
Title: Official HDB Map Services |
|
Title: Visualising 30 years of HDB resale flat prices between 1990 - 2019
Source: https://www.reddit.com/r/singapore/comments/dubsyk/visualising_30_years_of_hdb_resale_flat_prices/ |
|
Title: Distribution of 4-Room HDB Resale Prices By Town |
|
Title: Average HDB resale prices by town treemap Source: http://sgyounginvestment.blogspot.com/2018/03/visualisation-of-hdb-resale-prices-in.html |
|
Title: Visualizing the Affordability of 4 Room HDB Flats and Rental Growth |
|
REFERENCE LIST
References
- https://www.straitstimes.com/singapore/more-hdb-resale-flats-sold-in-october-after-higher-housing-grants-income-ceilings-kicked
- https://www.businesstimes.com.sg/hub-projects/property-2019-september-issue/hdb-resale-market-sees-strong-demand
- https://data.gov.sg/dataset/resale-flat-prices
KEY TECHNICAL CHALLENGES & MITIGATION
Technical challenges
STORYBOARD
stooryboard
MILESTONES
COMMENTS
| No. | Name | Date | Comments |
|---|---|---|---|
| 1. | (Name) | (Date) | (Comment) |
| 2. | (Name) | (Date) | (Comment) |
| 3. | (Name) | (Date) | (Comment) |


