Analysis & Recommendations
Revision as of 17:07, 21 March 2020 by Avrinelli.2019 (talk | contribs) (Created page with " == Analysis & Final Recommendations == To showcase the survey results, an interactive dashboard was created and shared on Tableau Public. The final is attached here. ==== Un...")
Analysis & Final Recommendations
To showcase the survey results, an interactive dashboard was created and shared on Tableau Public. The final is attached here.
Undergraduate
Demographics
| Demographics | Analysis |
|---|---|
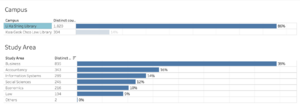
| As highlighted, the majority of undergraduate respondents prefer the Li Ka Shing Library (86%) to Kwa Geok Choo Law Library (16%). Furthermore business students filled out the survey much more than other areas of study. It will be important to keep this in mind as we walk through the analysis as the data is skewed in favor of these two groups. |
