IS428 AY2019-20T2 Assign DANIEL SOH WEI TONG
Contents
Problem and Motivation
Every two years, SMU Libraries conducts a comprehensive survey in which faculty, students and staff have the opportunity to rate various aspects of their services. The survey provides SMU Libraries with input to help enhance existing services and to anticipate emerging needs of SMU faculty, students and staff.
The reports are conducted by external vendors and presented in a written document accompanied by charts. With the large amount of data presented it is hard for the management to efficiently identify gaps within segment of their users and anticipate the emerging needs of SMU Libraries.
The interactive visualisation would be targetted at the following groups of users:
- SMU Management: To understand service gaps within SMU libraries and plan appropriate policies so that resources could be allocated efficiently.
- Library technology and Innovation Department: To derive insights from the data so that new policies or initiatives could be implement to improve the service of the libraries.
- Library Analytics department: To prepare the necessary reports and insights requested by internal or external sources.
Data Cleaning and Transformation
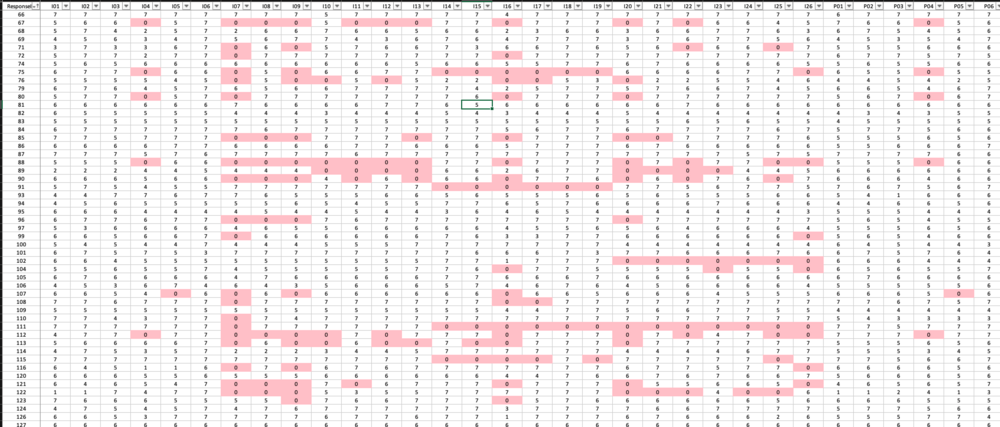
Data Cleaning 1. Survey data provided were cleaned - null cells were replaced with 0 using excel "Find and Replace" function.
2. Metadata for all questions were created in a separate sheet in excel. One such example is the position metadata.
Data Tranformation
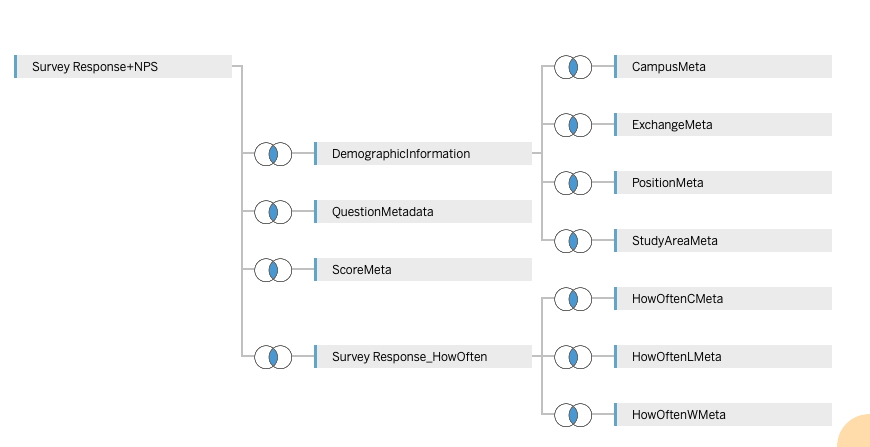
1. Data from the excel was imported into Tableau and inner join was used on all tables key.
2. Pivot function within Tableau was used to transform all survey questions from a "Wide" table to a "Long" table as per a database format. Each row in the database would represent a question.
Interactive Visualisation
Dashboard
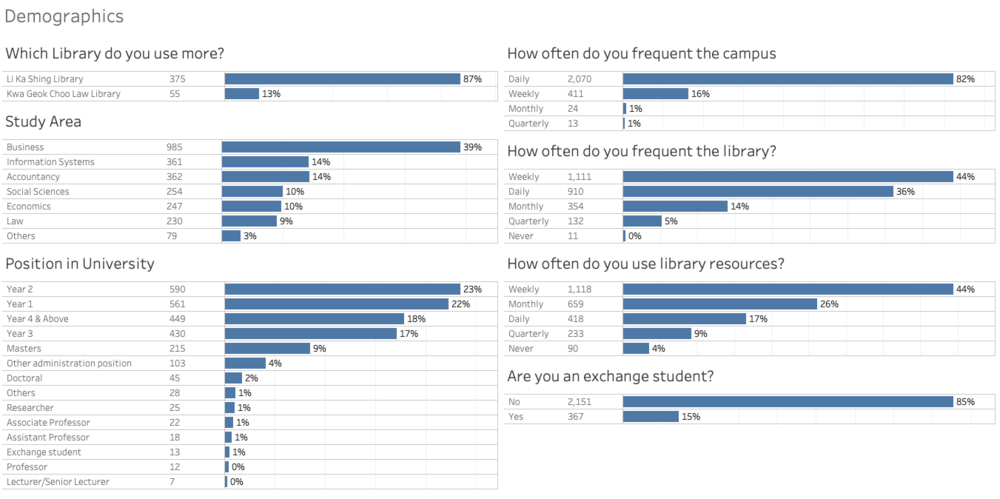
Key Demographics
Interactive Dashboard
Dashboard allowing users to explore different segments of survey respondents.
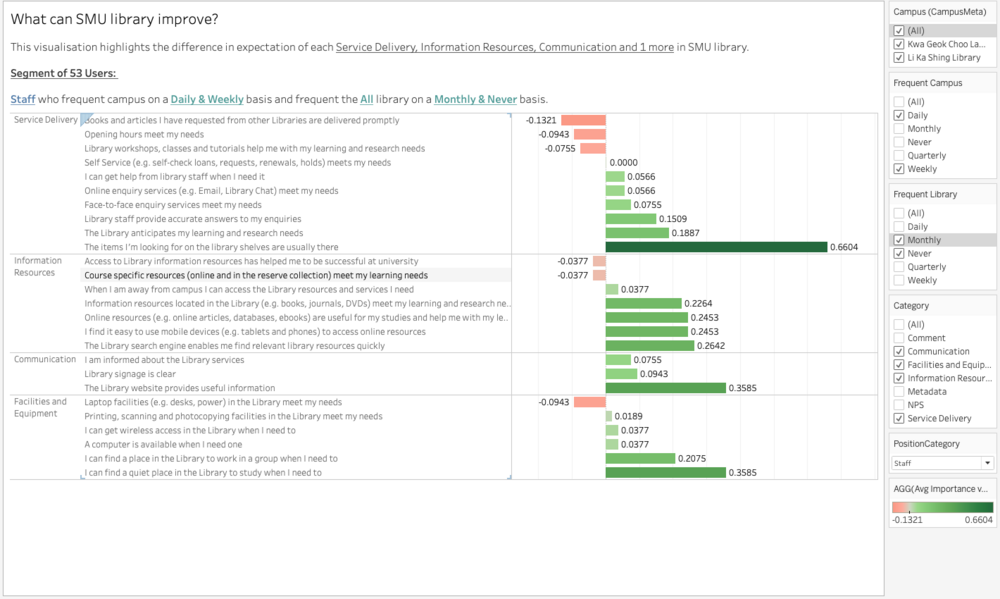
The graph represents the gaps in importance vs performance which is gap in value where the library can improve
Insights
To improve the library services, we look at four key segment of users and determine what are the causes behind the gaps in library services.
Segments
| Segment | Segment of Users | Rationale |
|---|---|---|
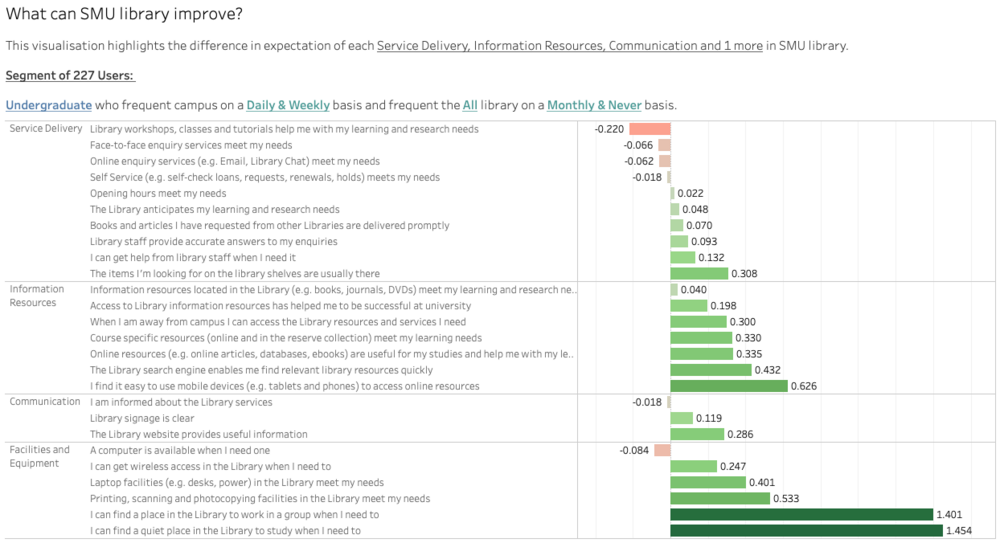
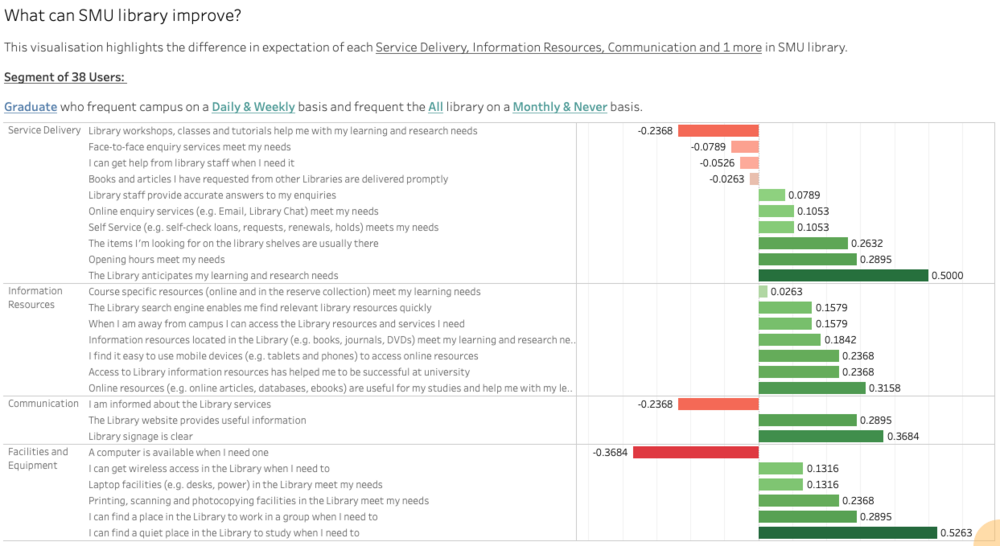
| 1 | Users who frequent the campus on a daily and weekly basis but only visited the library on a monthly or none basis | It would be useful to know why this segment of users who visit the campus often but choose not to visit the library. There could be value gaps that could be easily improved as they are often at campus. |
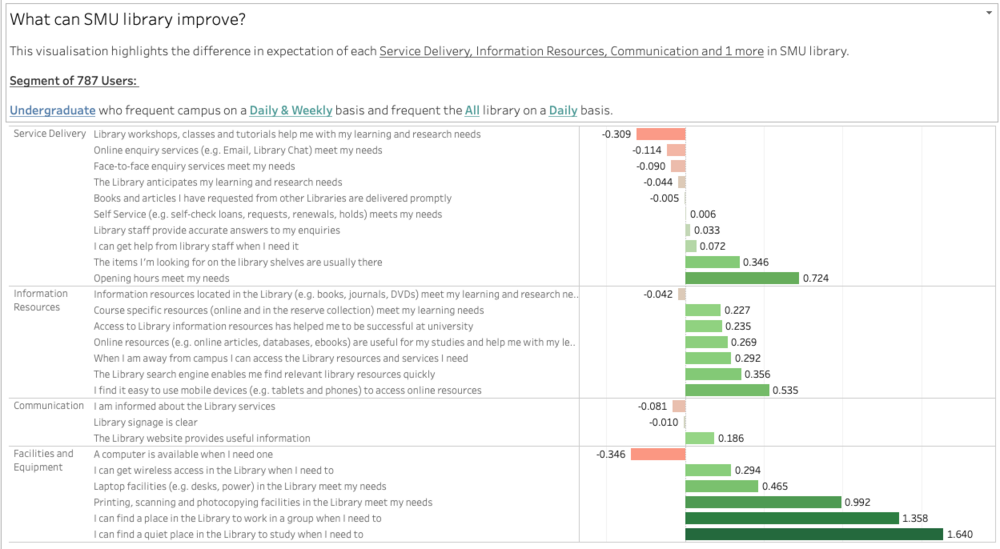
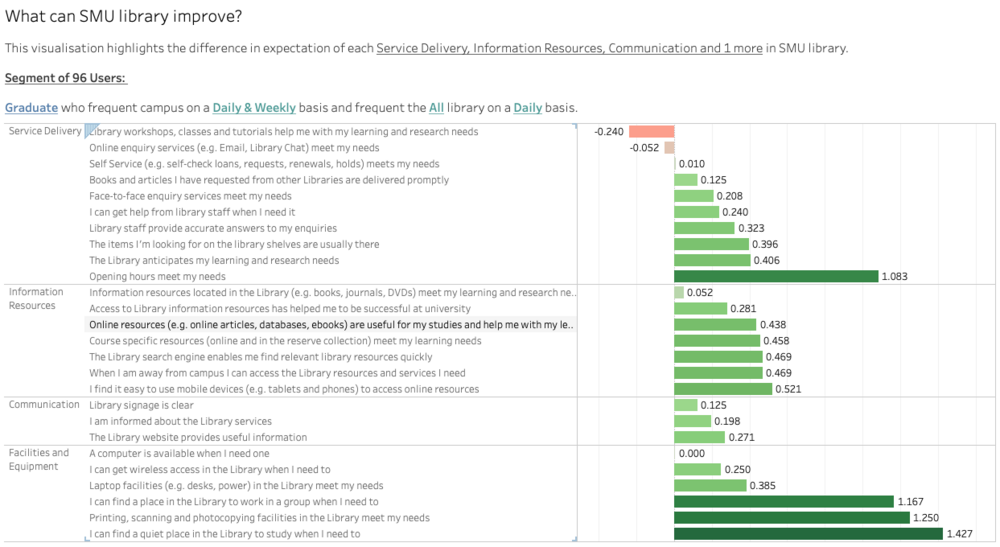
| 2 | Users who visits the library on a daily basis | It would be efficient way to boost user satisfaction on this core group of users that uses the library often. |
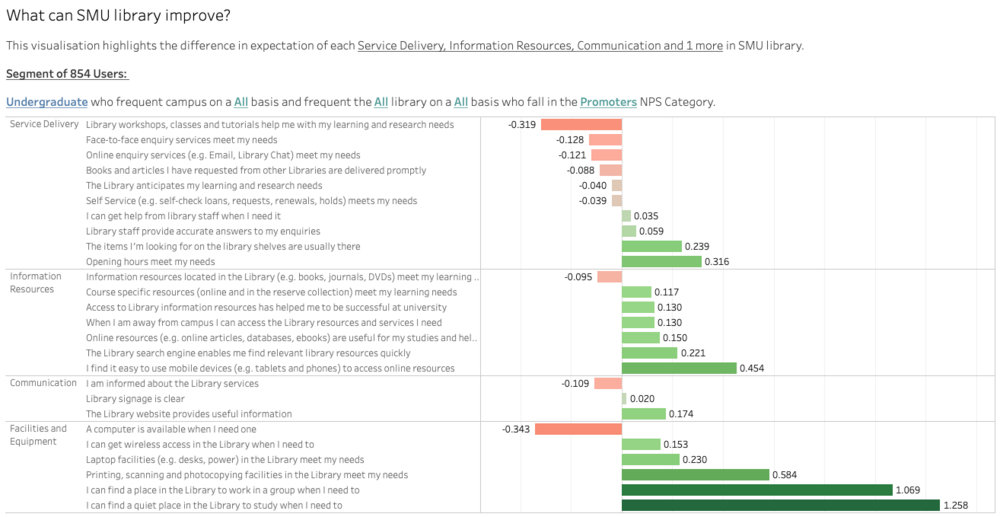
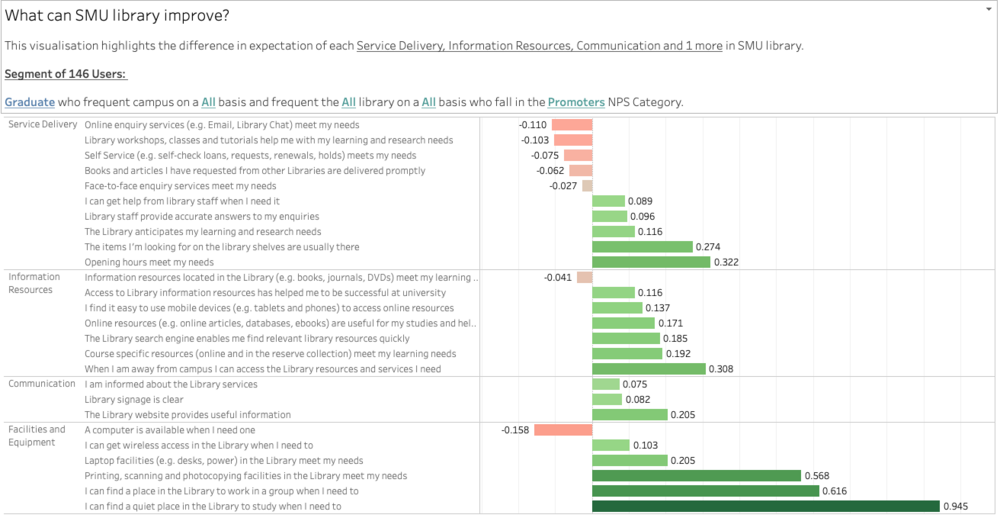
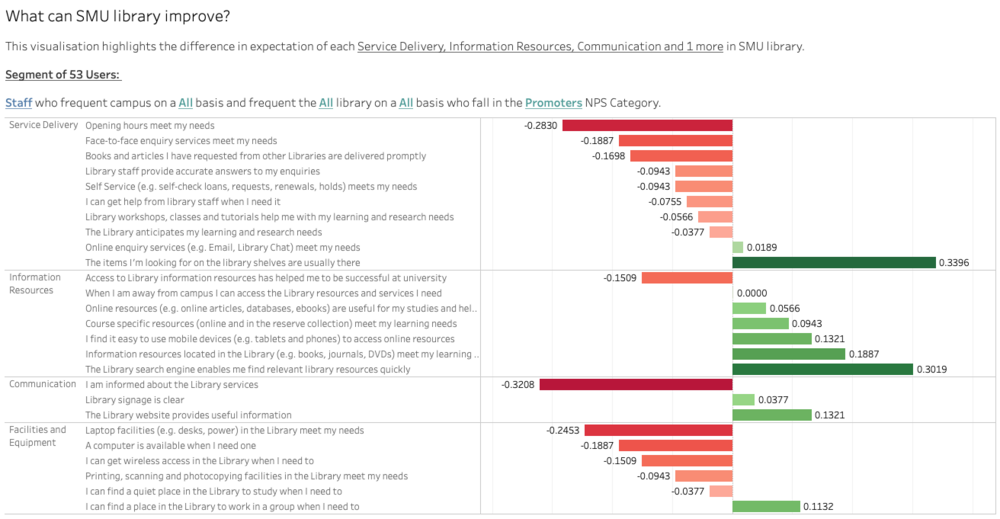
| 3 | Promoters (NPS) | It would provide deeper insights on which services within the library served the Promoters well. This factors could be used to reinforce and justify budget/resource allocation. (eg. Promotors indicated that laptop facilities (extra powerpoints) exceeded their expectation. This would serve as data to justify the spending) |
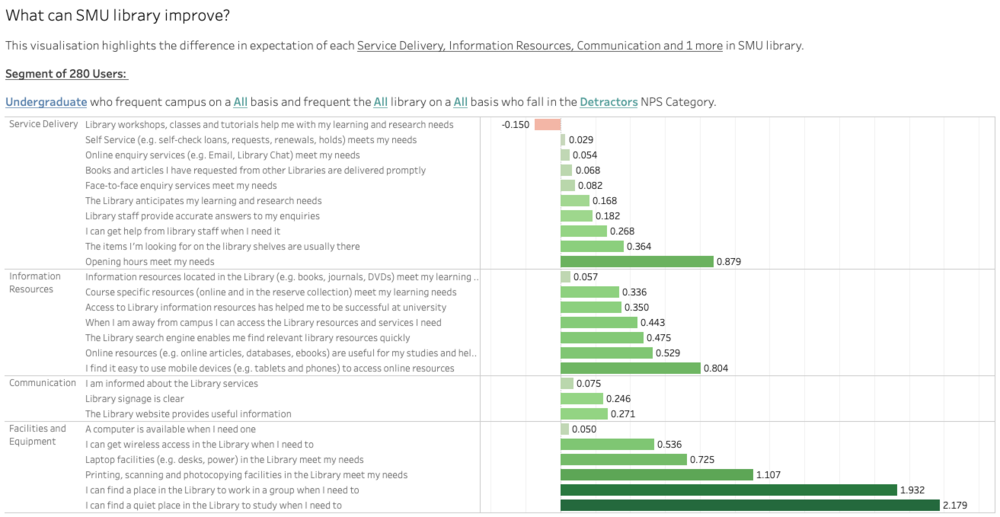
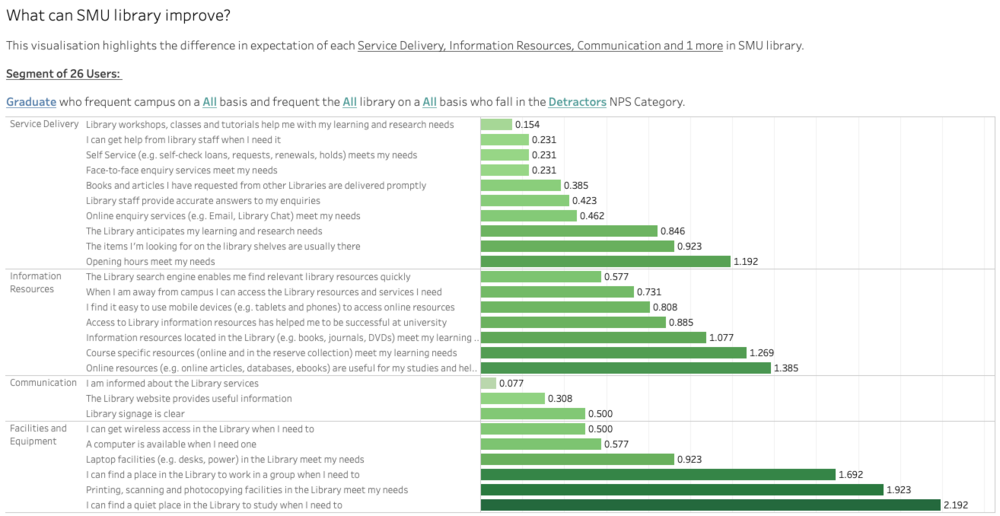
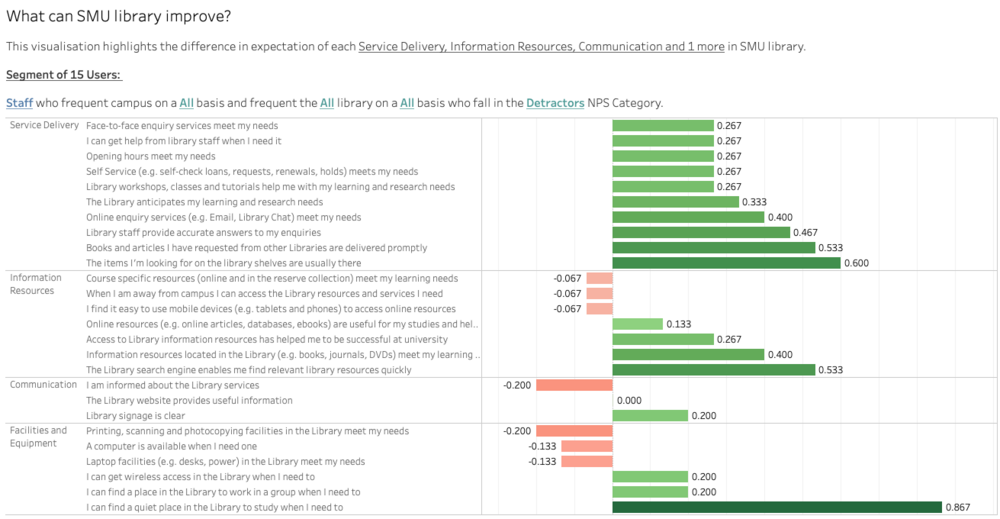
| 4 | Detractors (NPS) | It would provide deeper insights on factors that could be addressed to increase user satisfaction. |
Undergraduate Students
Segment 1: Frequent campus often but not the library
Frequent the campus on a daily and weekly basis but only visited the library on a monthly or none basis
Insights: The top three gaps that this segment of users face:
- Lack of workshops to help with learning and research needs.
- Lack of computers when they need one
- Lack face to face enquiry services
Top three factors that exceeded their expectations:
- Can find a quiet space to study when i need to
- Can find a place in the library for group work
- Easy to use mobile devices to access online resources.
Key Insight: This group of users hardly use the library facilities despite being in campus daily. They are able to find a spot in the library given their once per month visit to the library. This does not indicate a capacity issue for this group of users. There could be a lack of purpose to visit the library (for example they prefer to study outside/at home). The management could plan for more workshops, classes and tutorials to engage with this group of users and draw them to the library.
Segment 2: Frequent library on a daily basis
Insights: The top three gaps that this segment of users face:
- Lack of computers when they need one
- Lack of workshops to help with learning and research needs.
- Lack face to face enquiry services
Top three factors that exceeded their expectations:
- Can find a quiet space to study when i need to
- Can find a place in the library for group work
- Printing facilities met their needs
Key Insight: This group of users use the library facilities daily. They form the core group of foot traffic to the library and are likely to be optioned the library service levels. Any changes with the library policies are likely to affect this group of users. The library has done well to allocate sufficient quiet space and group meeting areas for this core group of users. This group of users indicated that they lack computers when they needed one. The management has to investigate deeper into the type of computers required as most university students would have their personal laptop to work with. The computers indicated could be special use terminals (eg bloomberg terminals) that are only available in limited numbers.
Segment 3: Promoters (NPS)
Problem: The top three issues that this segment of users face
- Lack of computers when they need one
- Lack of workshops to help with learning
- Lack face to face enquiry services
Recommendations:
- Recommendations would be similar as the previous undergraduate segment. Survey team should find out more details on the computers required
Segment 4: Detractors (NPS)
Postgraduate Students
Segment 1: Frequent campus often but not the library
Frequent the campus on a daily and weekly basis but only visited the library on a monthly or none basis
Problem: The top three issues that this segment of users face
- Lack of workshops to help with learning
- Lack of computers when they need one
- Lack face to face enquiry services
Recommendations:
- Lack of workshops to help with learning
- Lack of computers when they need one
- Lack face to face enquiry services
Segment 2: Frequent library on a daily basis
Problem: The top three issues that this segment of users face
- Lack of workshops to help with learning
- Lack of computers when they need one
- Lack face to face enquiry services
Recommendations:
- Lack of workshops to help with learning
- Lack of computers when they need one
- Lack face to face enquiry services
Segment 3: Promoters (NPS)
Segment 4: Detractors (NPS)
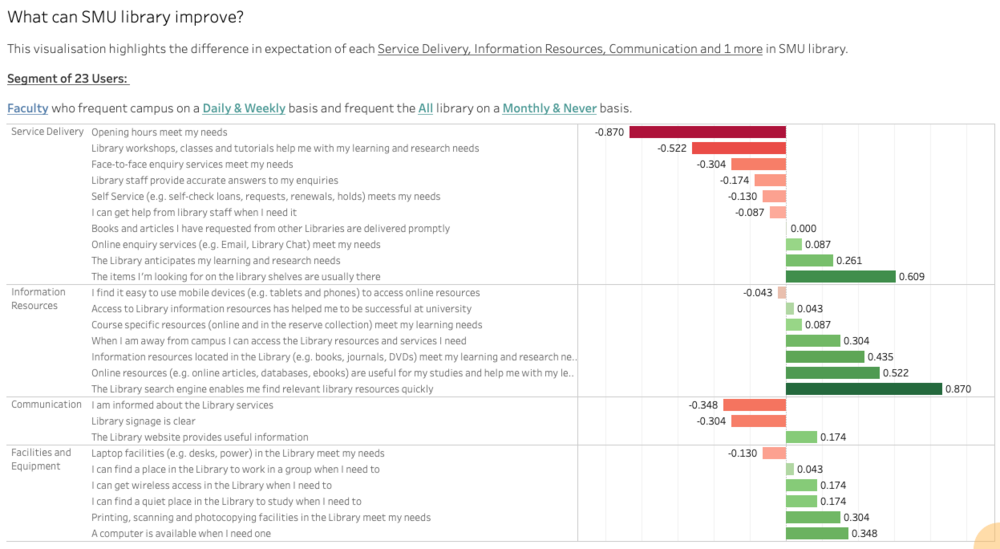
Faculty
Segment 1: Frequent campus often but not the library
Frequent the campus on a daily and weekly basis but only visited the library on a monthly or none basis
Problem: The top three issues that this segment of users face
- Opening hours
- Library workshops
- Library services
Recommendations:
- Library hours could be extended during peak working periods
- A survey could be done to find out what kind of workshops this segment of users would like
- Newsletter to communicate library services
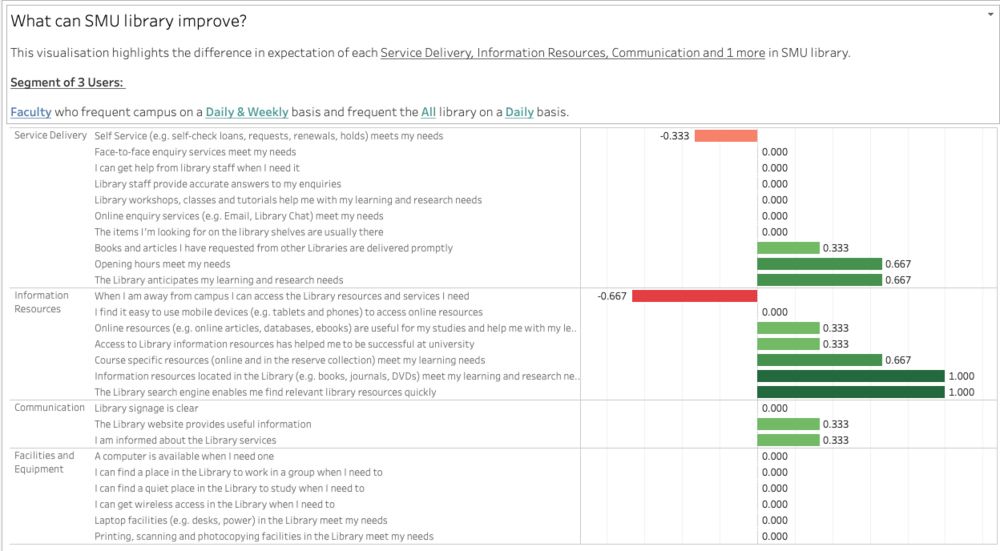
Segment 2: Frequent library on a daily basis
As this segment only consist of three users. The data collected would not be statistically significant. Removing this segment from the analysis.
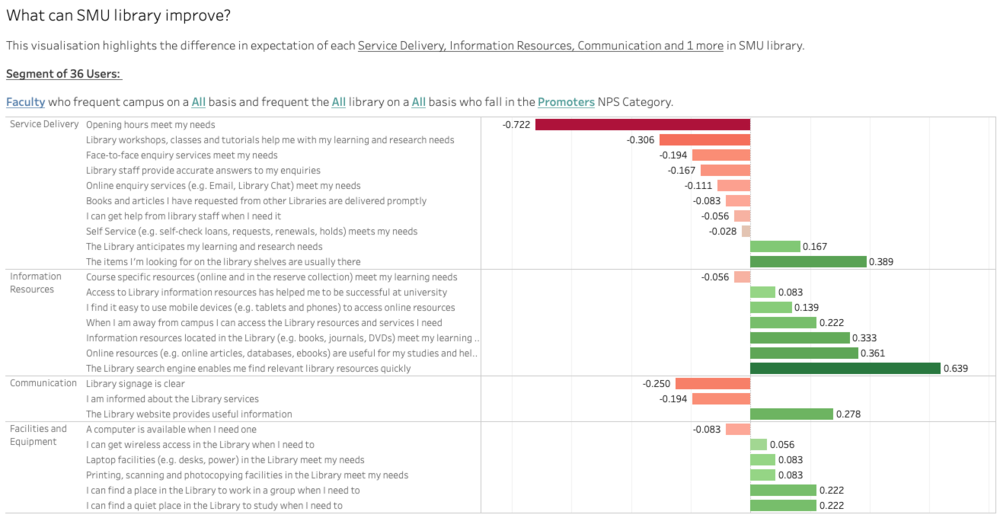
Segment 3: Promoters (NPS)
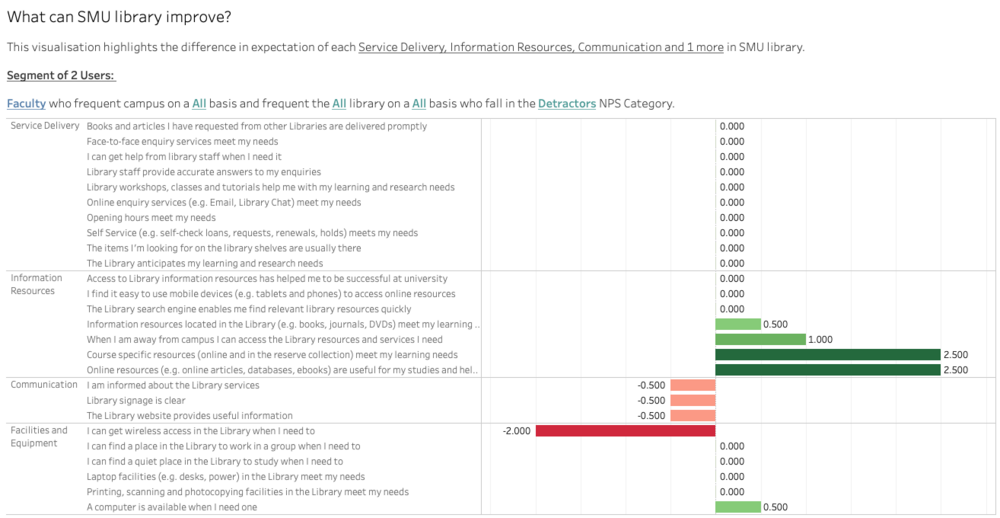
Segment 4: Detractors (NPS)
Staff
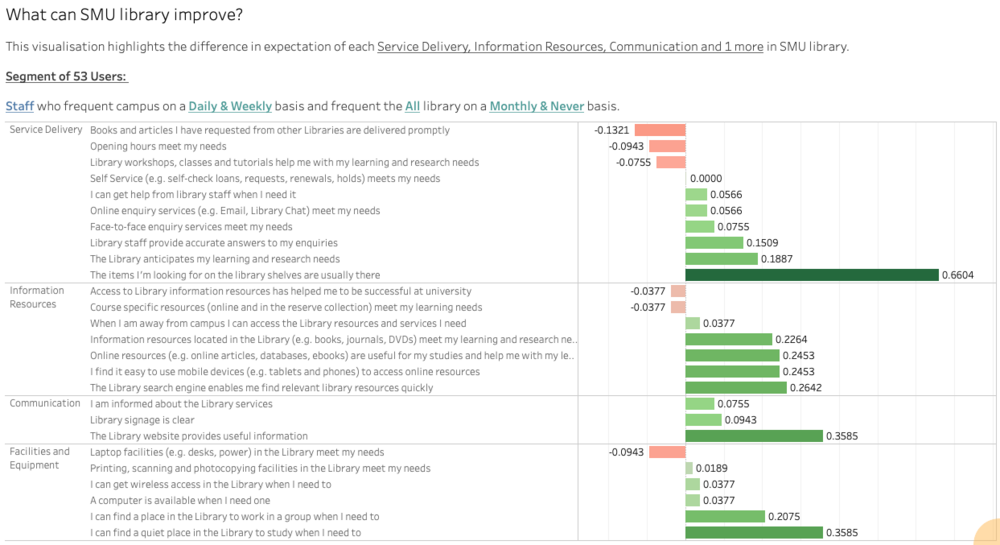
Segment 1: Frequent campus often but not the library
Frequent the campus on a daily and weekly basis but only visited the library on a monthly or none basis
Problem: The top three issues that this segment of users face
- Books requested are not delivered promptly
- Opening hours does not meet user's needs
- Laptop facilities does not meet users needs
Recommendations:
- Lack of workshops to help with learning
- Lack of computers when they need one
- Lack face to face enquiry services
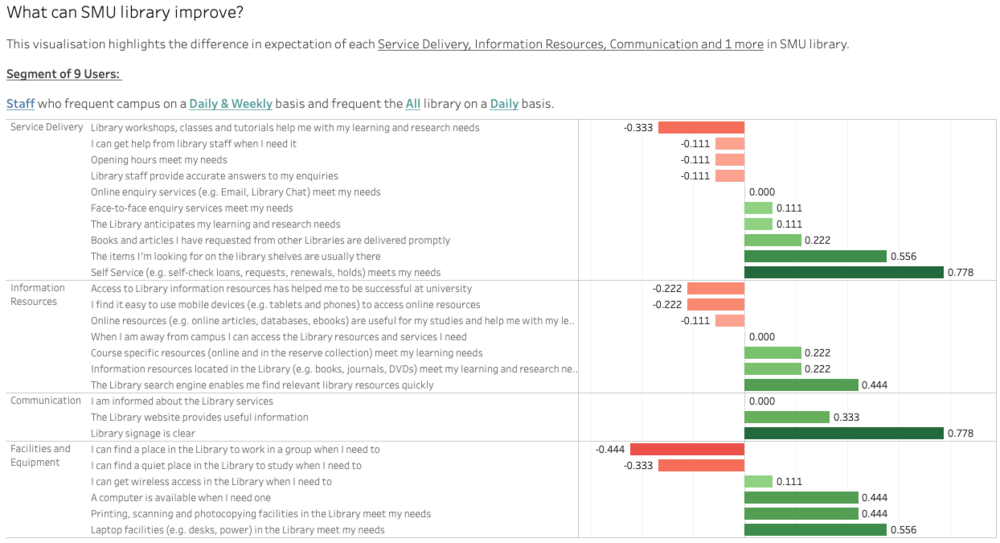
Segment 2: Frequent library on a daily basis
Problem: The top three issues that this segment of users face
- Lack of workshops to help with learning
- Lack of computers when they need one
- Lack face to face enquiry services
Recommendations:
- Lack of workshops to help with learning
- Lack of computers when they need one
- Lack face to face enquiry services
