IS428 AY2019-20T2 Assign RYAN WONG POH FAI
Contents
Data Preparation
For Data Preparation, I referred to the following video for some guidance.
Data Cleaning and Transformation
| Screenshots | Steps |
|---|---|
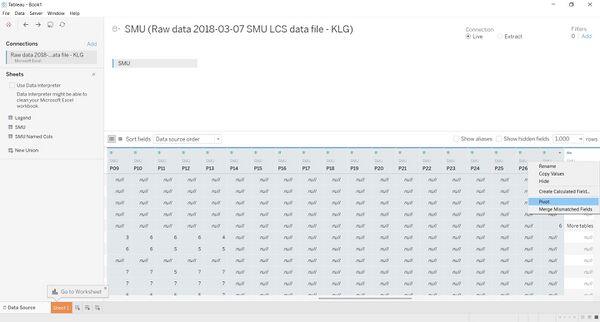
| 1. Pivot I01-I26, P01-P27 | |
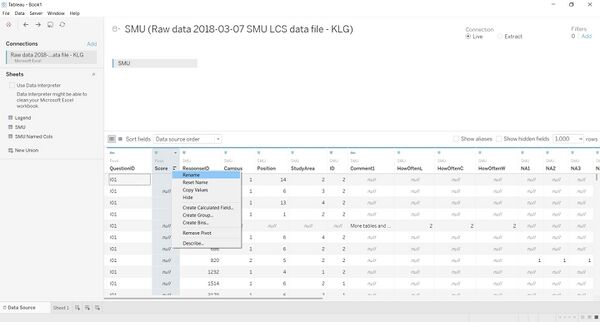
| 2. Rename Pivot Field Names and Pivot Field Values to "QuestionID" and "Score" respectively | |
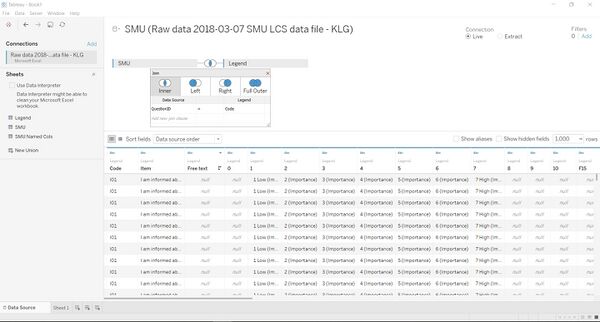
| 3. Drag Legend and Inner Join with SMU tab (QuestionID = Code) | |
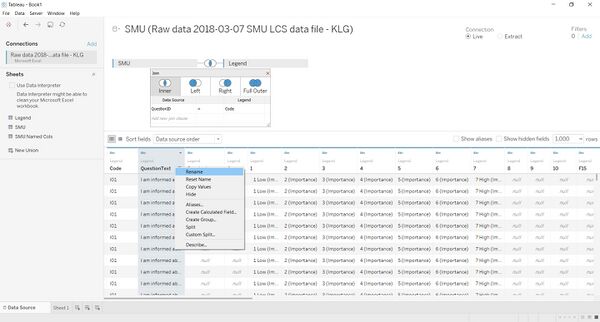
| 4. Rename Item Column to QuestionText | |
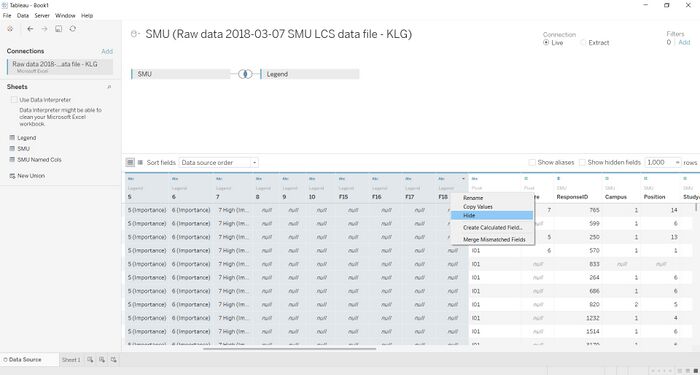
| 5. Hide Columns: Code, Free text, 0-10, F15-F18 | |
| 6. In a new Sheet, Duplicate Position under Measures > Rename it as Position (Category) | |
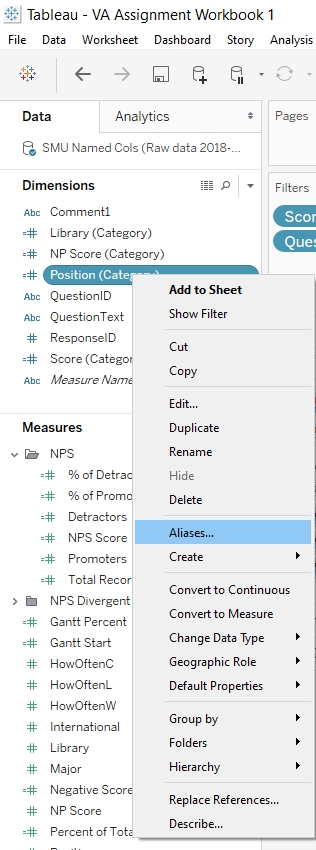
| 7. Create Aliases for Position | |
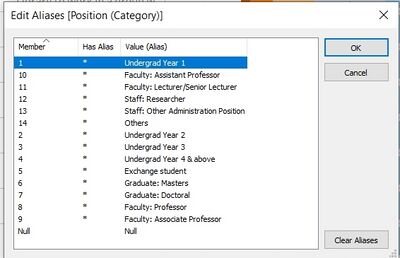
| 8. Rename Aliases for Position | |
| 9. Duplicate Library under Measures > Rename it as Library (Category) | |
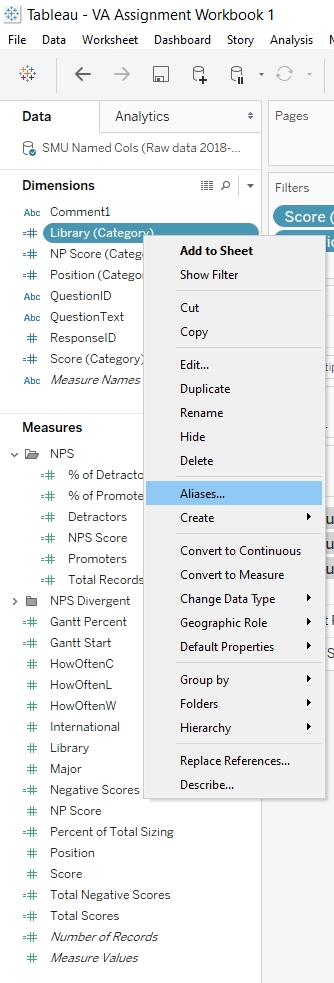
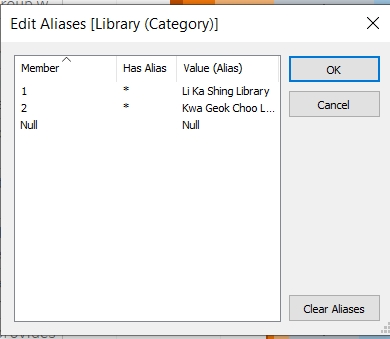
| 10. Create Aliases for Library | |
| 11. Rename Aliases according to the screenshot | |
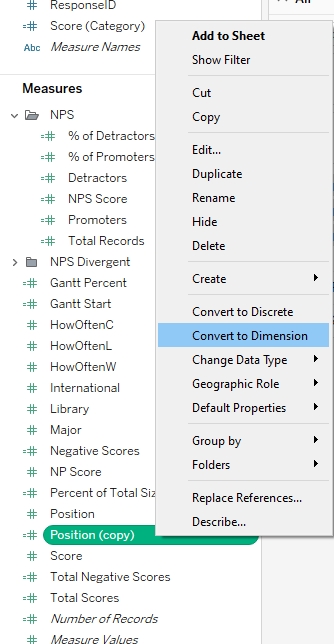
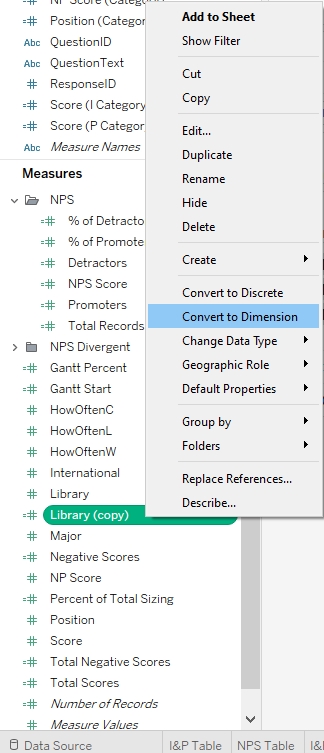
| 12. Under Measures, duplicate Score and convert it to a dimension
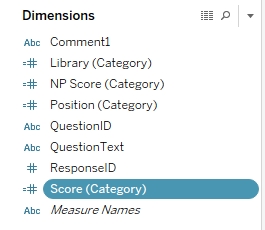
13. Then, rename the Score dimension to "Score (Category)" |
Comments on Survey
One issue with the Library Survey is that it does not assign a description to each score. The Survey only gave a description of Low for a score of 1, and a description of High for a score of 7. The Survey should improve on this by providing descriptions for each score. An example given:
| Score | Description |
|---|---|
| Not important at all / Not satisfied at all | |
| Not important / Not satisfied | |
| Slightly not important / Slightly unsatisfied | |
| Neutral | |
| Slightly important / Slightly satisfied | |
| Important / Satisfied | |
| Extremely Important / Extremely satisfied |
By providing descriptions, survey respondents will have a better idea of what each score represents. Therefore, for the purposes of analysing this survey, I will assume that the scores follow the table above.
Analysis and Insights
Dashboard Link
Dashboard can be downloaded from here: Tableau Public
Undergraduates
Importance
For undergraduates, these are the 5 Most Important Library services:
- Q18 - I can get wireless access in the Library when I need to
- Q14 - I can find a quiet place in the Library to study when I need to
- Q19 - Printing, scanning and photocopying facilities in the Library meet my needs
- Q17 - Laptop facilities (e.g. desks, power) in the Library meet my needs
- Q06 - Opening hours meet my needs
Performance
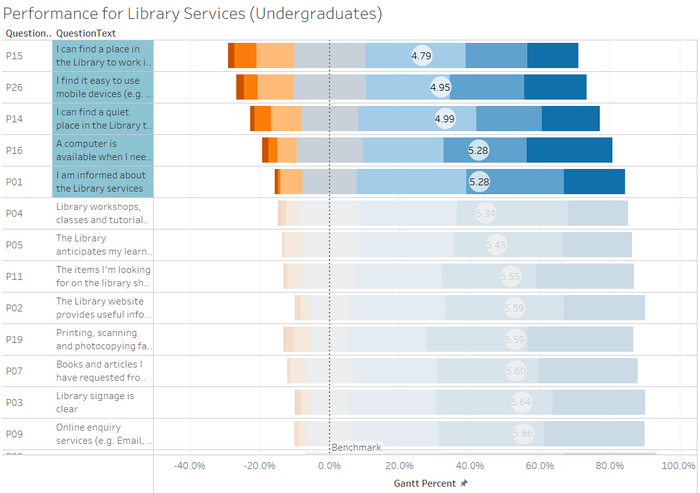
The 5 Worst Performing Services for Undergraduates are:
- P15 - I can find a place in the Library to work in a group when I need to
- P26 - I find it easy to use mobile devices (e.g. tablets and phones) to access online resources
- P14 - I can find a quiet place in the Library to study when I need to
- P16 - A computer is available when I need one
- P01 - I am informed about the Library services
As for the 5 Best Performing services:
- P12 - Library staff provide accurate answers to my enquiries
- P21 - Online resources (e.g. online articles, databases, ebooks) are useful for my studies and help me with my learning and research needs
- P08 - Self Service (e.g. self-check loans, requests, renewals, holds) meets my needs
- P13 - I can get help from library staff when I need it
- P18 - I can get wireless access in the Library when I need to
Biggest gaps between Importance and Performance
I have ranked the areas in order of the largest average score gap between Importance and Performance.
- Q14 - I can find a quiet place in the Library to study when I need to (Gap: 1.59)
- Q15 - Finding a place in the Library to work in a group when needed (Gap: 1.41)
- Q19 - Printing, scanning and photocopying facilities in the Library meet my needs (Gap: 0.83)
- Q26 - I find it easy to use mobile devices (e.g. tablets and phones) to access online resources (Gap: 0.66)
- Q06 - Opening hours meet my needs (Gap: 0.5)
Based on the areas identified above, it shows that SMU Library should first prioritise improving the amount of spaces needed for students to study and work in a group. There was also a huge gap in the printing, scanning and photocopying facilities of SMU Library, hence SMU library should look towards finding more ways to increase the amount of printers.
Undergraduates also experience a gap in using mobile devices to access online resources at SMU Library. Hence, SMU Library should focus on improving mobile access to their online resources.
As for opening hours, undergraduates still feel a lack in the current operating hours of SMU Library.
Comparison between LKS and KGC Library as a Study/Work Space
From the survey, Undergraduates who use Kwa Geok Choo Library more often tend to find it better in providing a space for students to study or work in a group. Kwa Geok Choo Library actually scored better when comparing both averages. However, both scores are still relatively weak and would still need to be improved on.
Net Promoter Score
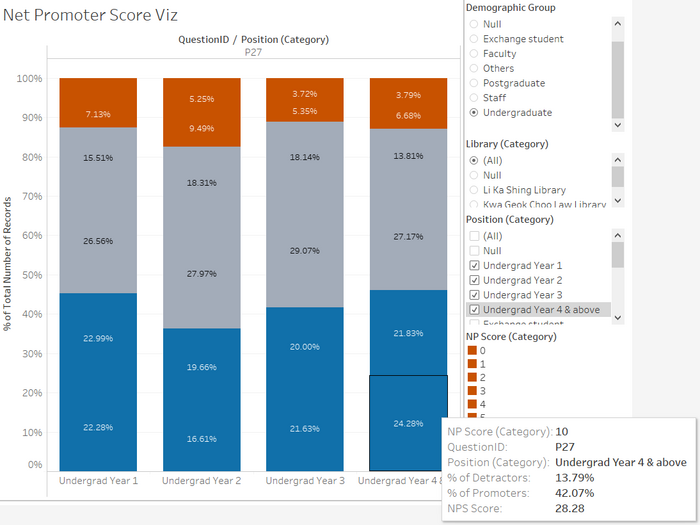
The total NPS for Undergraduates is 28.28. Note that for this visualization, the NPS Score calculated field within the tooltip is taken across all Undergraduates. This shows that overall, Undergraduates are pleased with SMU Library and are likely to recommend the Library to others.
After comparing the NPS between the different years of Undergraduates, Year 2 students scored the lowest in terms of NPS at 18.81. One likely cause of the year 2’s NPS could be the incident where Kwa Geok Choo Library was flooded and they had a bad first-time experience with SMU Library. This shows that the Library should have focused on the Year 2 Undergraduates during 2018 to find out what caused the huge difference in NPS.
Postgraduates
Importance
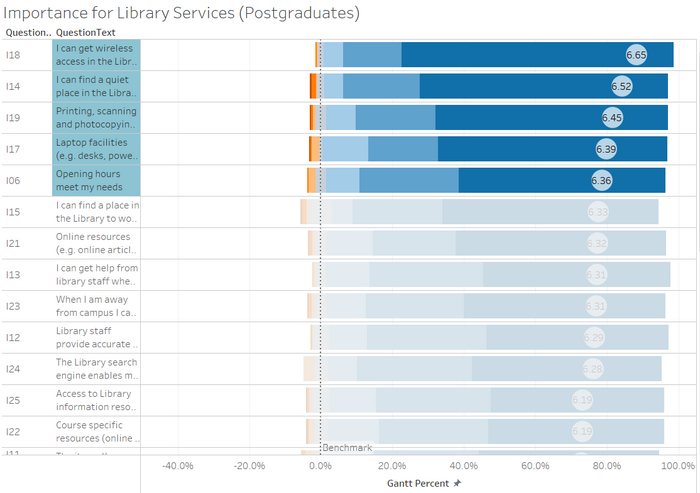
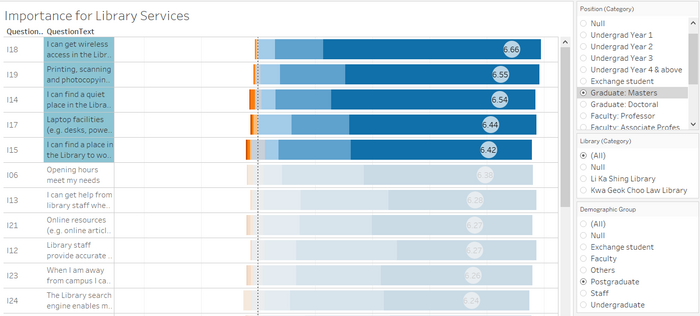
For postgraduates, the 5 Most important services are:
- I18
- I14
- I19
- I17
- I06
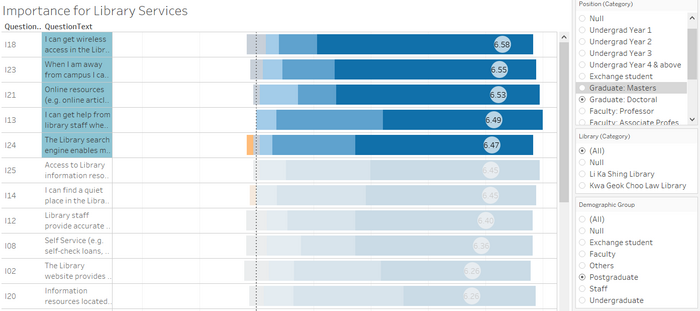
When looking at the 5 most important services between Masters and Doctoral postgraduates, there was actually a difference.
For Masters students: 1. I18 2. I19 3. I14 4. I17 5. I15
For Doctoral students:
- I18
- I23
- I21
- I13
- I24
Performance
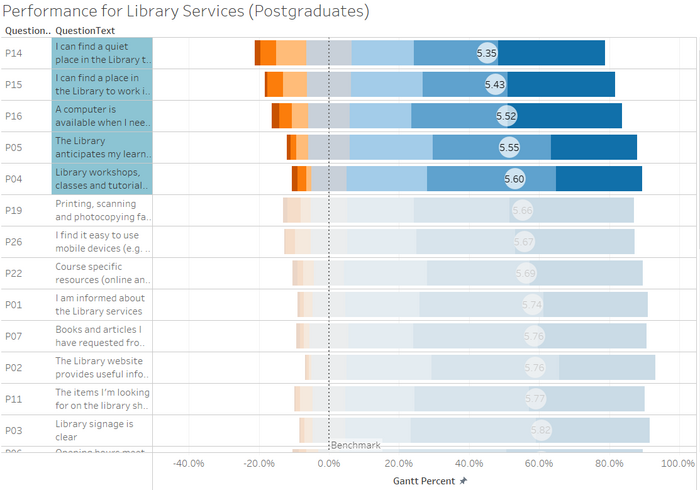
The 5 Worst Performing Library Services for Postgraduates are:
- P14
- P15
- P16
- P05
- P04
The 5 Best Performing Library Services for Postgraduates are:
- P17
- P08
- P12
- P13
- P18
Net Promoter Score
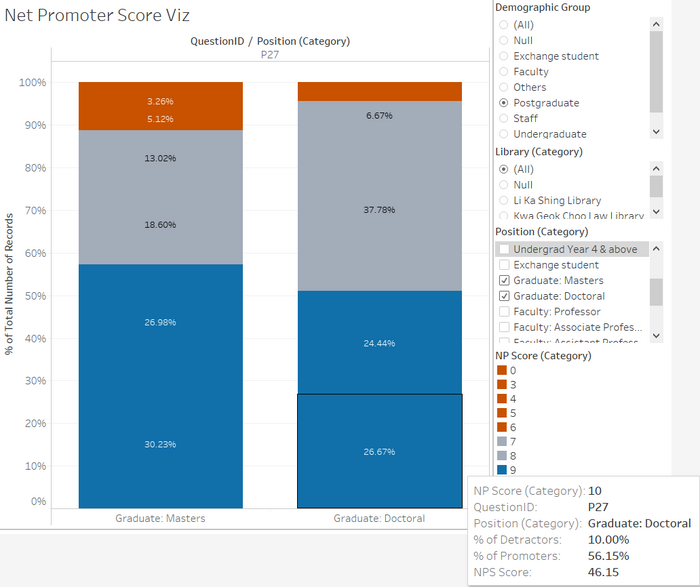
In terms of Net Promoter Score, Postgraduates scored much higher as compared to Undergraduates at 46.15, showing that they are much more likely to recommend SMU Library to others as compared to Undergraduates.
Both Masters and Doctoral students have very similar Net Promoter Scores, with Masters students’ NPS at 46.05 and Doctoral students’ NPS at 46.67. Showing that both groups of Postgraduate students are satisfied with SMU Library’s services.
Faculty
Importance
The 5 most important services for Faculty are:
- I21
- I24
- I23
- I13
- I25
Performance
The 5 worst performing services for Faculty are:
- P16
- P19
- P15
- P14
- P05
The 5 best performing services for Faculty are:
- P08
- P09
- P12
- P13
- P07
Net Promoter Score
The total NPS for Faculty overall scored 57.63. This is much higher as compared to the Undergraduates and Postgraduates and shows that Faculty are more likely to recommend the Library to others.
After finding out that the only detractors within the Faculty were Lecturers/Senior Lecturers, I decided to take a look at the Performance Levels for Library services response from Lecturer/Senior Lecturers. I Identified that the main struggles they face are in the photo below.
- P14 and P15: Not being able to find a quiet place in the Library to work at alone or in a group
- P22: Finding that the Course-specific resources do not meet their learning needs
- P05
- P10
- P07
- P21
Hence, should SMU Library want to improve the service levels for Lecturers/Senior Lecturers, they can look into the above areas.
Staff
Importance
For the Staff, the 5 most important services are:
- I18
- I13
- I21
- I14
- I12
Performance
As for the 5 worst performing services:
- P16
- P04
- P05
- P26
- P11
As for the 5 best performing services:
- P08
- P12
- P06
- P13
- P18
Net Promoter Score
The total NPS for Staff overall totalled to 29.69. This makes Staff the demographic with the 2nd lowest NPS, meaning that they are much less likely to recommend the Library to other
After diving into the NPS scores for each sub-group, I found that Researchers only have an NPS of 16, which was the main reason why the overall NPS for Staff scored so low.
After looking into the Performance service levels for Researchers, I found the 5 worst performing services for Researchers:
- P26
- P24
- P01
- P02
- P05
