IS428 AY2019-20T2 Assign SHERRY TAO SHI HUA
Contents
Overview
Background
In light of the ever-changing needs and requirements of faculty, students and staff, an extensive and comprehensive survey is conducted every two years, in which the users of both the Li Ka Shing Library and Kwa Geok Choo Law Library have the opportunity to rate various aspects of their services. The results aim to learn about the users’ perception of both libraries, especially in terms of importance and performance, and provides SMU libraries with input to help enhance existing services to adapt and improve their services.
Objective and Tasks
A Library Survey Report is generated after the survey. However, upon closer scrutiny of the report, we can see that it comprises of many pages of tables and confusing charts, which are difficult for users of the report to comprehend and find out the areas to improve. Hence, our objective is to apply appropriate data visualisation using what we have learnt in class to transform these into interactive visualisations so that users can save effort in understanding and making out the meaning of the tables and charts and focus on the main perceptions and areas of improvement, allowing for greater gain of useful insights to SMU Libraries.
The task is split into four groups of users’ perceptions:
- undergraduates,
- postgraduates,
- faculty and
- staff.
Since these four groups are so varied, they may have different perceptions of the various importance and performance of the library services, of which we need to further explore and gleam insights from.
Data preparation
Dataset
The 2018 Library Survey dataset is used for this Assignment, since the 2020 Library survey ended in late February and the dataset is not published. There are 2639 responses in this dataset, each to a unique Response ID. Of the 88 variables left in the dataset (excluding the unique identifier Response ID), 26 of the 88 are not applicable (NA01 to NA26) and will be excluded from the visualisations.
Of the 62 variables remaining in the dataset, 9 variables contains information on demographics of the respondent, such as which library they use more frequently (Campus), what their field of study is (StudyArea), how frequently they visit the campus, the library and accessing library resources (HowOftenL, HowOftenC, HowOftenW), which year of study they are in (Position), whether they are an international student (ID), net promoter score (NPS1) and an open-ended comment section (Comment1). The open-ended comment section will be excluded from the visualisations as well.
Of the rest of the 53 variables, 26 of them (I01 to I26) measures the importance of each assessment item while another 26 (P01 to P26) measures the performance of the same assessment items. All measures are in Likert Scale, from 1 to 7, stating how important or well-performed the assessment item is in each respondent’s view. The final variable (P27) is an overall satisfaction of the library, measured under Performance.
Data Cleaning and Transformation
| Screenshots | Description and Steps Taken |
|---|---|
|
|
Since the fields NA01 to NA26 are not applicable, they are excluded from the visualisations
|
|
|
The data is in a row format, with every row corresponding to a ResponseID, indicating the respondent. However, Tableau cannot do calculations on data like this, and it needs to be pivoted so that we can proceed with the later steps
|
|
|
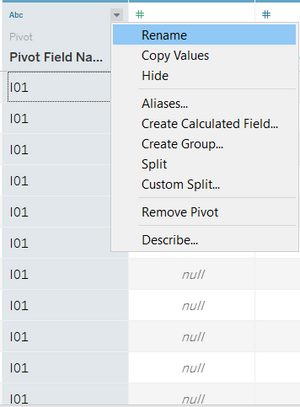
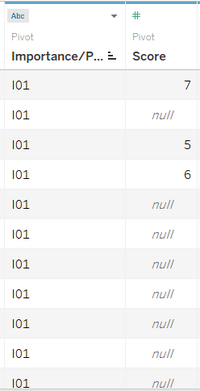
After pivoting the data, Tableau automatically names the column with the I01 to I26 and NA01 to NA27 as "Pivot Field Names" and the column with the respective scores as "Pivot Field Values". To help us recognise the fields better, "Pivot Field Names" is renamed as "Importnance/Performance" and "Pivot Field Values" is renamed as "Score".
|
|
|
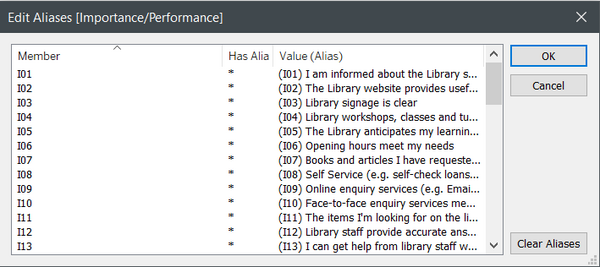
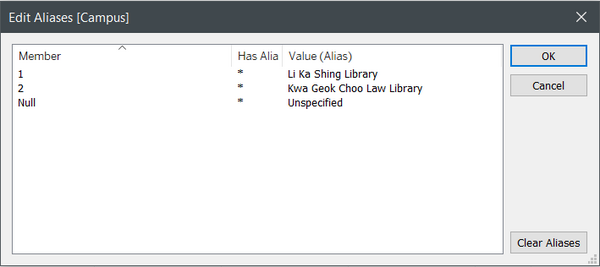
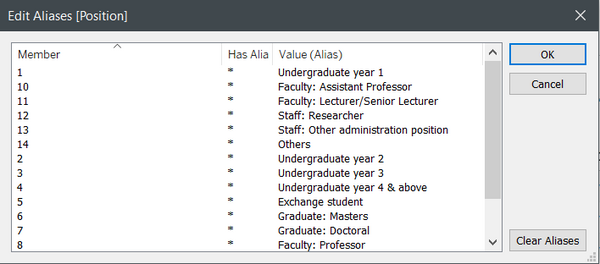
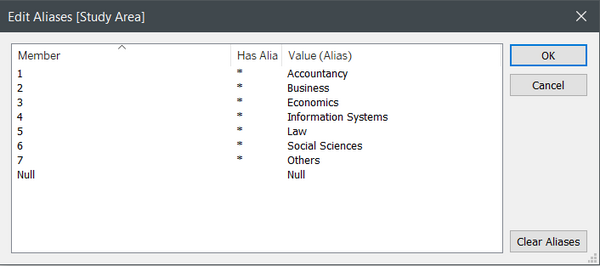
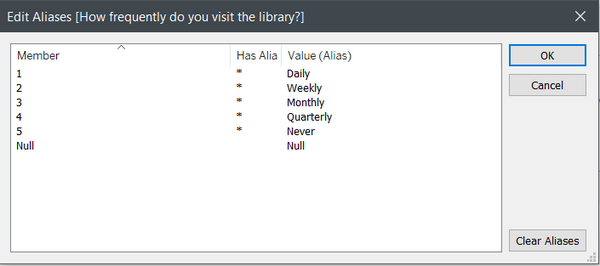
There are several fields with numbers as the data in the Excel file, but they are actually codes that symbolises some discrete data. To have a clearer representation of the data, aliases are created in place of the numbers.
|
|
|
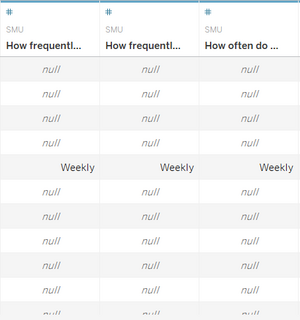
There are several other fields that need renaming for quicker recognition, namely "HowOftenL", "HowOftenC" and "HowOftenW". These are renamed as "How frequently do you visit the library?", "How frequently do you visit the Campus?" and "How often do you access library resources (e.g. online articles, databases, ebooks)?" respectively.
|
|
|
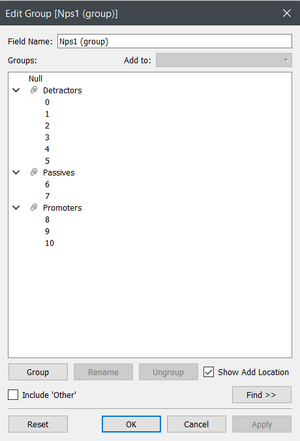
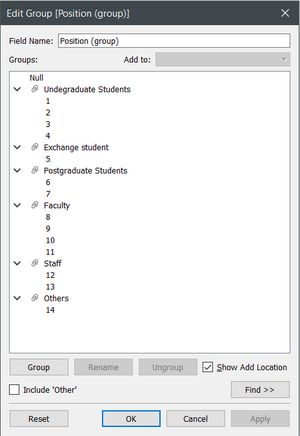
There are data in the columns that can be grouped, such that similar traits are represented in the group. One column where the responses can be grouped is Net Promoter Score, responses from 0 to 5 are Detractors, responses from 6 to 7 are Passives and responses from 8 to 10 are promoters, according to the Library Survey Report. Another column is the Position, where Undergraduates from the different years are grouped together, Postgraduates Masters or Doctoral are grouped together, different positions in the Faculty are grouped together and both types of Staff are grouped together.
|
|
|
To create a divergent stacked bar chart for the responses in the Likert Scale, several calculated fields need to be created. These are:
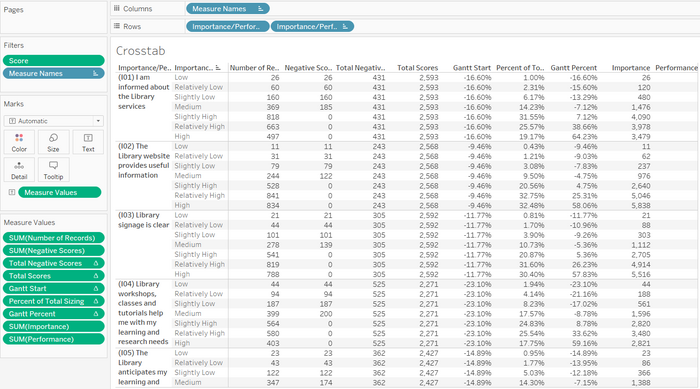
After each calculated field, drag the newly created field into the sheet to create a Crosstab to check the validity and accuracy of the calculations.
|
|
|
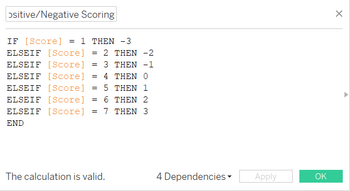
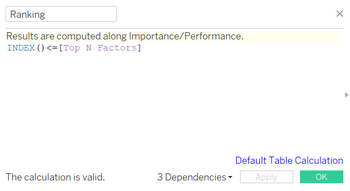
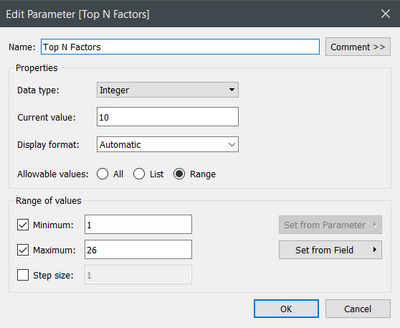
There are a total of 26 services in the survey that are ranked by both their importance and performance. However, we do not want to analyse the entire list of factors all at once, but focus on the top few based on how positive the services are ranked by scoring each score. To achieve this, we first have to create a Positive/Negative scoring system, then set a parameter so that the number of services that are being looked at can be varied. Then we need a calculated field to filter the list to only the number of services stipulated by the parameter.
|
Interactive Visualization
Link
Link to Dashboard: https://public.tableau.com/profile/sherry.tao#!/vizhome/IS428_AY2019-20T2_Assign_SherryTaoShiHua/Dashboard1?publish=yes
Dashboard Overview
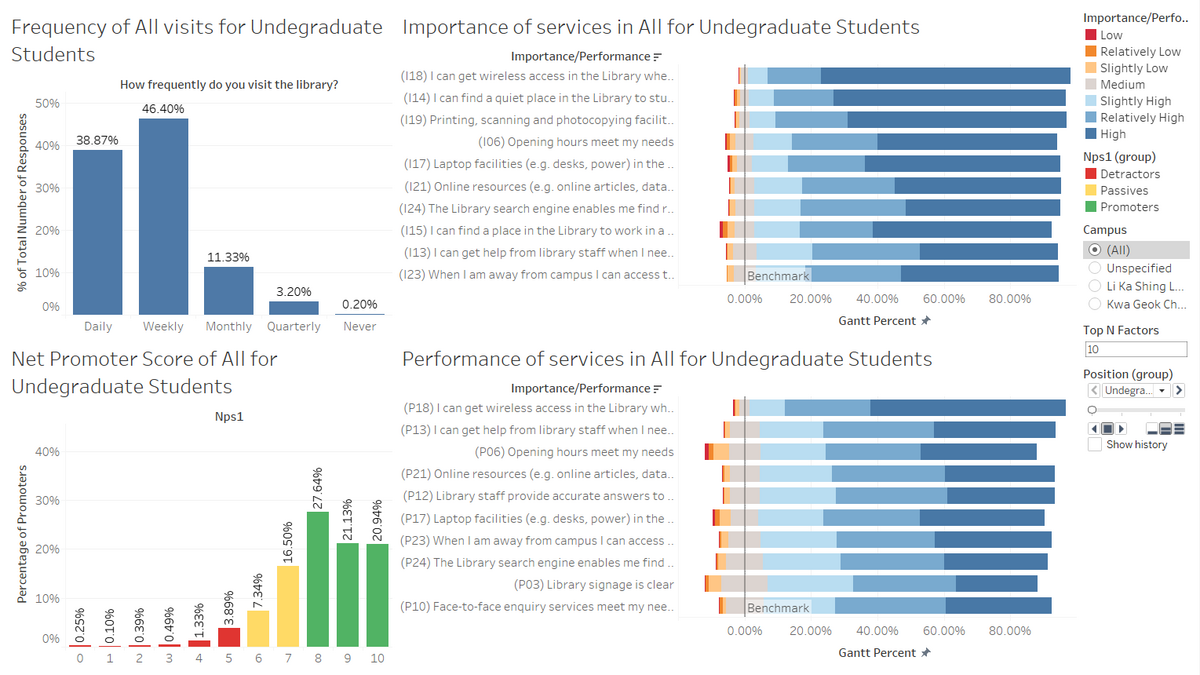
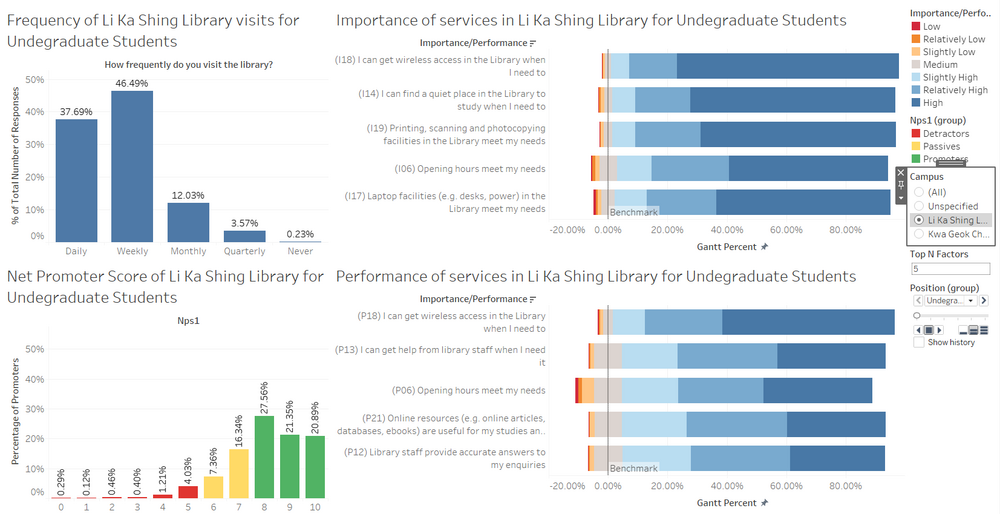
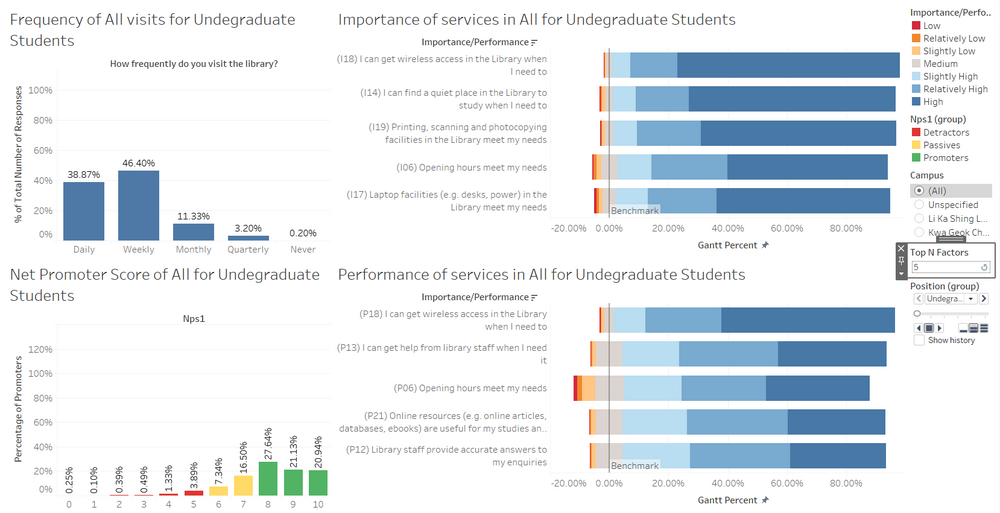
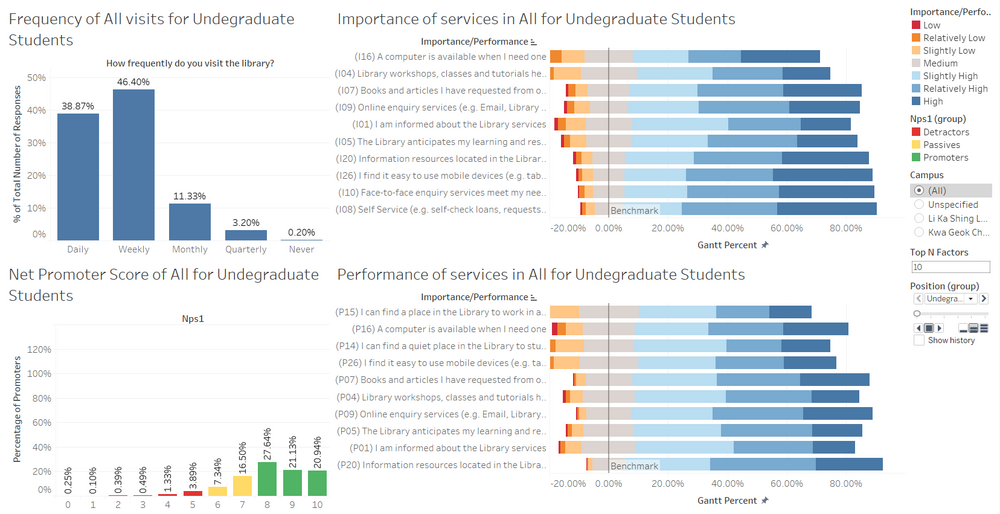
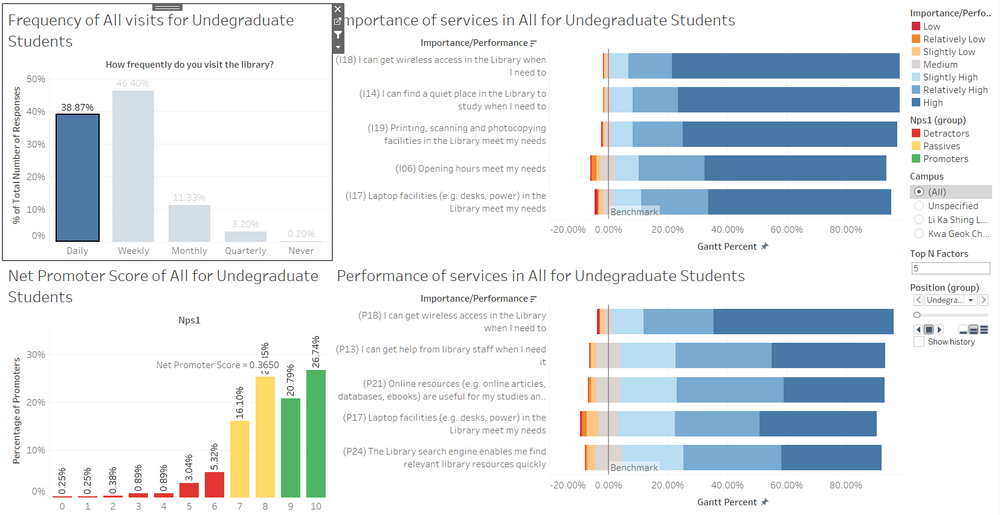
This is the overview of my Dashboard. By default, the Dashboard shows all responses from Undergraduates for both the Li Ka Shing Library and the Kwa Geok Choo Library. The Importance and Performance of the services have been ranked and the top 10 are shown by default. The individual components that make up this dashboard is further explained below.
Components
Frequency of Library visits
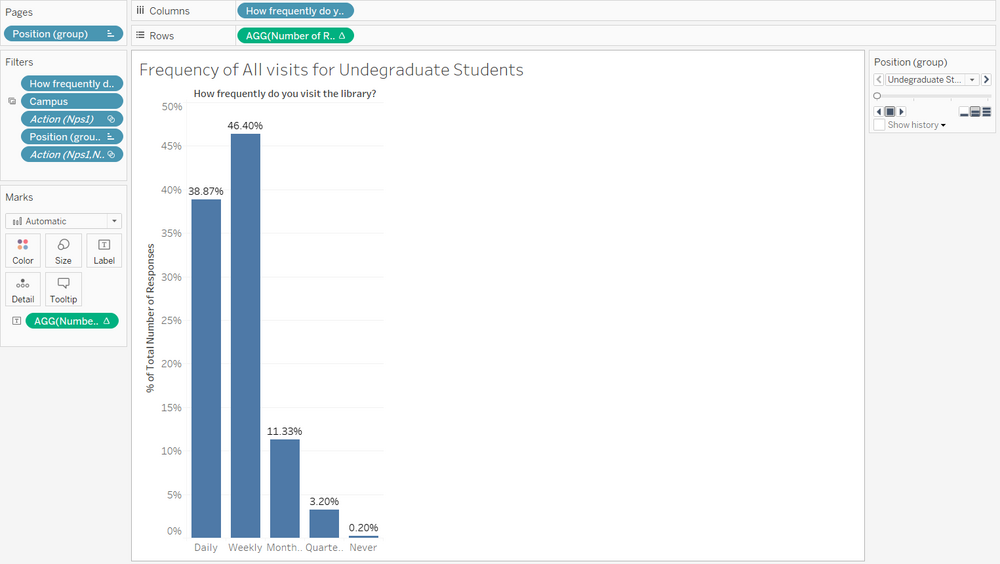
On the top left of the Dashboard is the bar graph for frequency of library visits. The columns (Daily, Weekly, Monthly, Quarterly, Never) show the frequency and the height of the bar shows the percentage of respondents by group (default being Undergraduate Students) that corresponded to each column.
Net Promoter Score
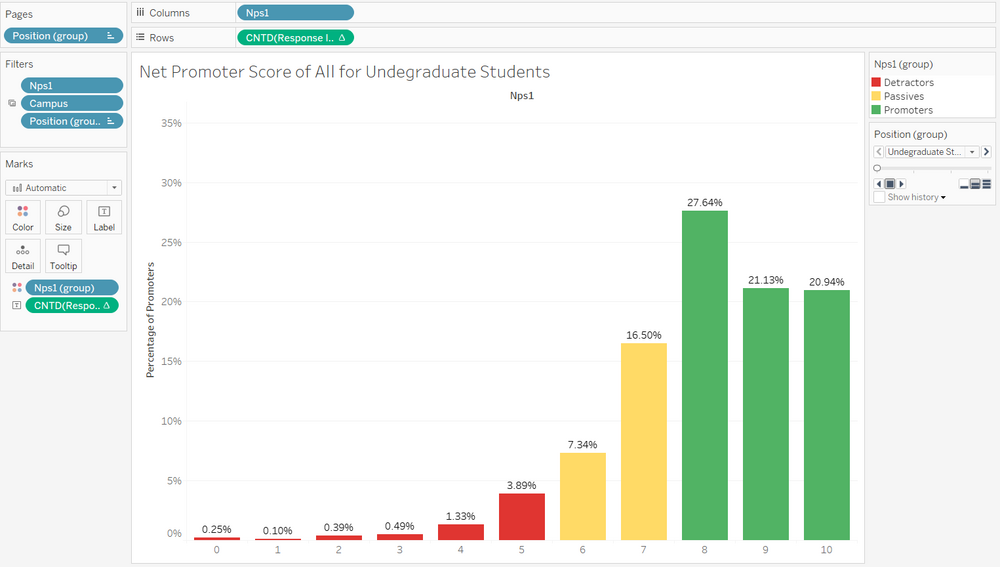
On the bottom left of the Dashboard is the bar graph for Net Promoter Score. The columns (0 to 10) show the possible range of Net Promoter Scores and the height of the bar shows the percentage of respondents by group (default being Undergraduate Students) that corresponded to each column. The colour on the graph shows those who are Detractors, Passives and Promoters. Detractors are those that are unhappy about the Library, Passives are those that are satisfied but not enough to recommend the Library, and Promoters are those that would encourage others to use the Library.
Importance and Performance
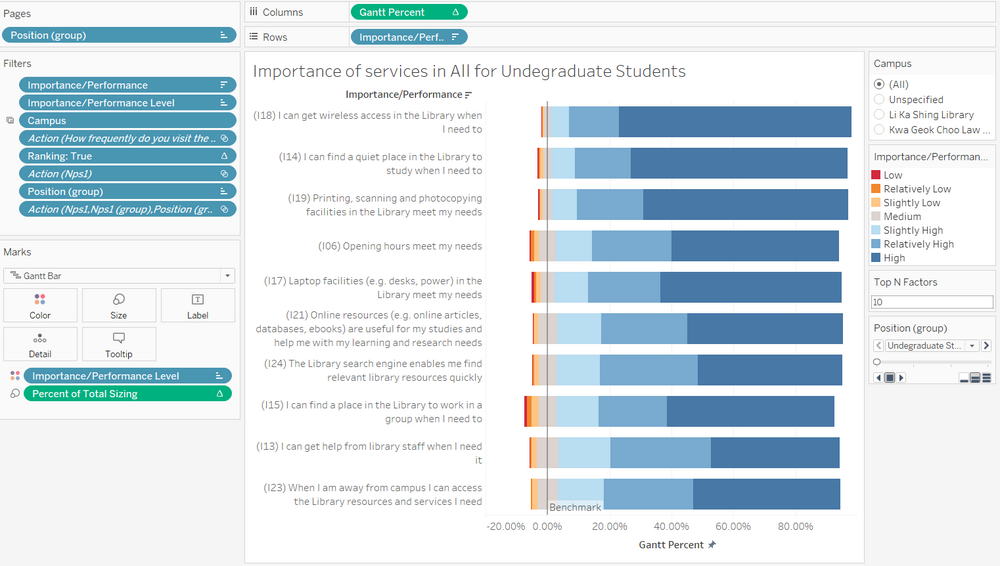
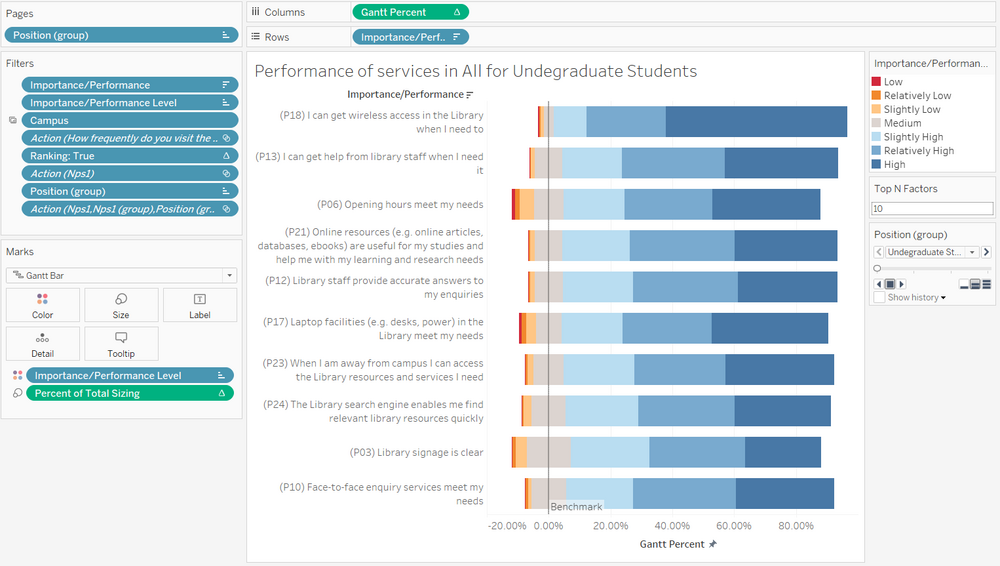
On the top right of the Dashboard is the divergent stacked bar chart for respondents' perception on the importance of each service that the Library offers, and the bottom right of the Dashboard is the divergent stacked bar chart for respondents' perception on the performance. The responses are on a Likert Scale, hence a divergent stacked bar chart is appropriate to draw insights from the respondents' perceptions. By default, the Top N services can be seen as stipulated by the user input of N, up to a value of 26. The colour of the graphs correspond to those who believe the Importance/Performance to be low to high, with the lower values coloured red and the higher values coloured blue. Those that are on the fence are coloured grey, since they are on neither end of the spectrum.
Interactive Elements
Sidebar
There are several interactive elements present on the side bar.
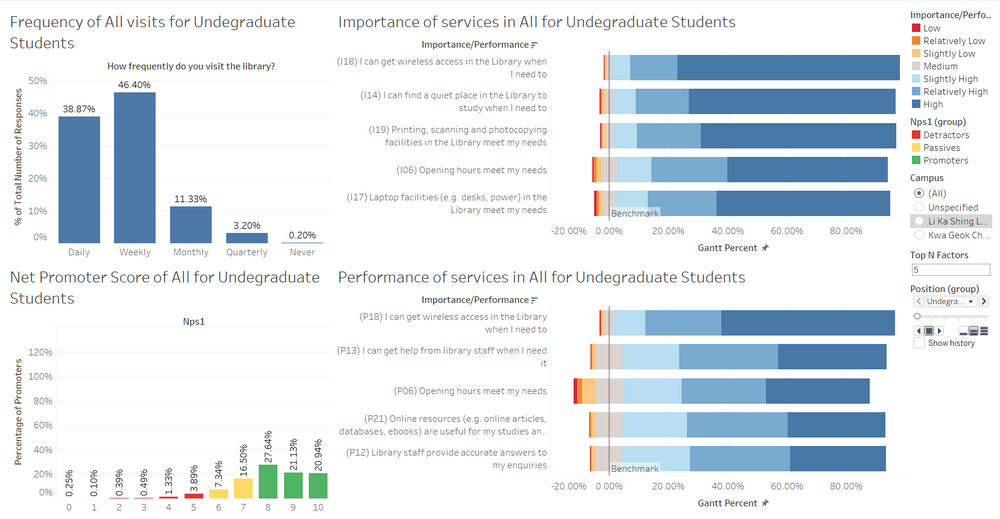
Firstly, this is a filter for the Campus that the user would like to analyse. By changing the filter of Campus, all 4 components in the Dashboard will be filtered and showing only the responses from respondents that use Li Ka Shing Library more frequently in this case. Notice that the titles of each of the 4 components are being changed as well.
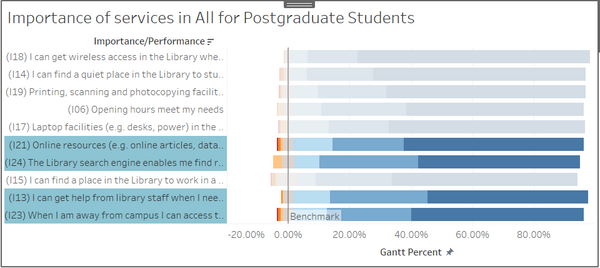
Next, this is a filter for the Top N services to look at by Importance/Performance. Users are able to change the values from 1 to 26, and by changing the filter, the Importance and Performance sheets will be filtered to only the Top N services.
Finally, this is a Pages filter for the group of respondents by position (Undergraduates, Postgraduates, Faculty and Staff). Users are able to scroll through the pages manually, or click the play button to let it loop automatically. Notice that the titles of each of the 4 components are being changed as well.
Charts
Apart from the sidebar, the graphs for frequency of library visits and Net Promoter Score are interactive as well. By clicking on individual bars on either chart, it will filter the other 3 components by that bar.
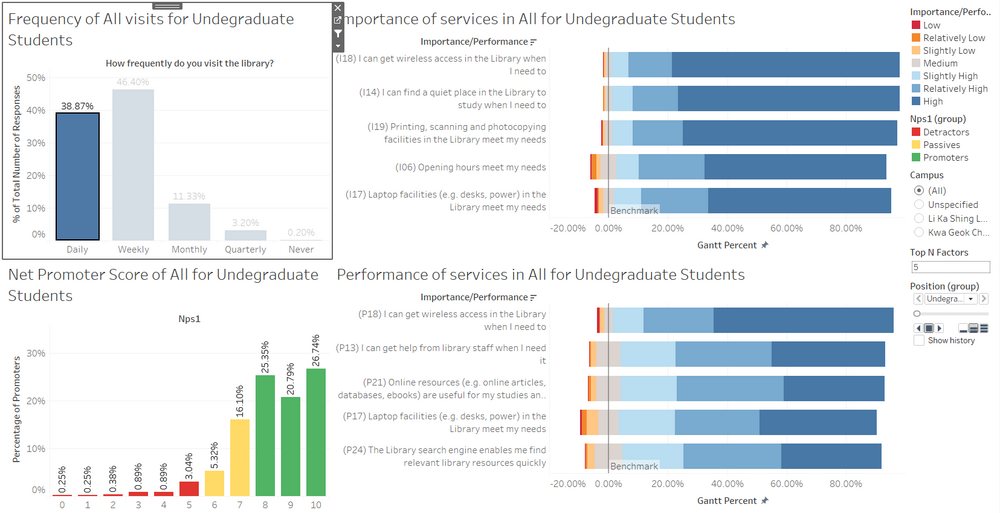
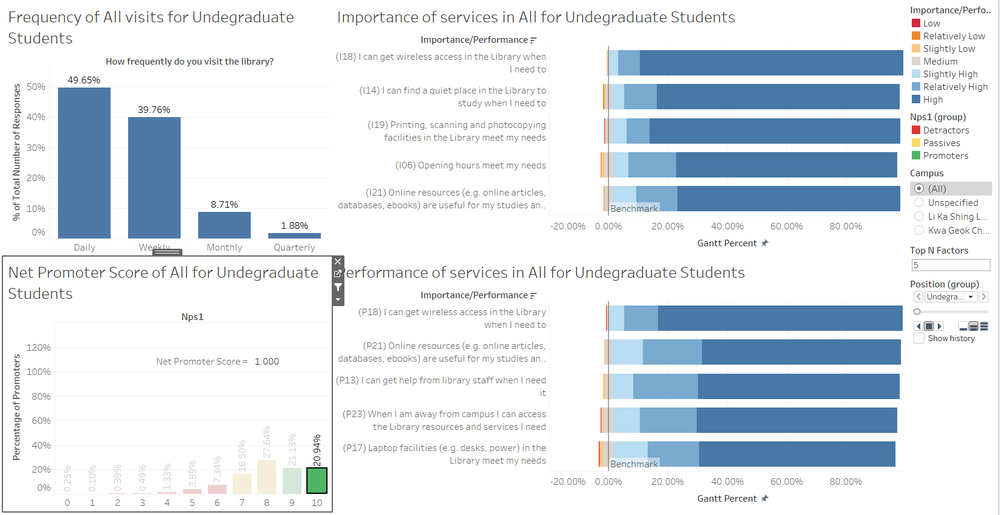
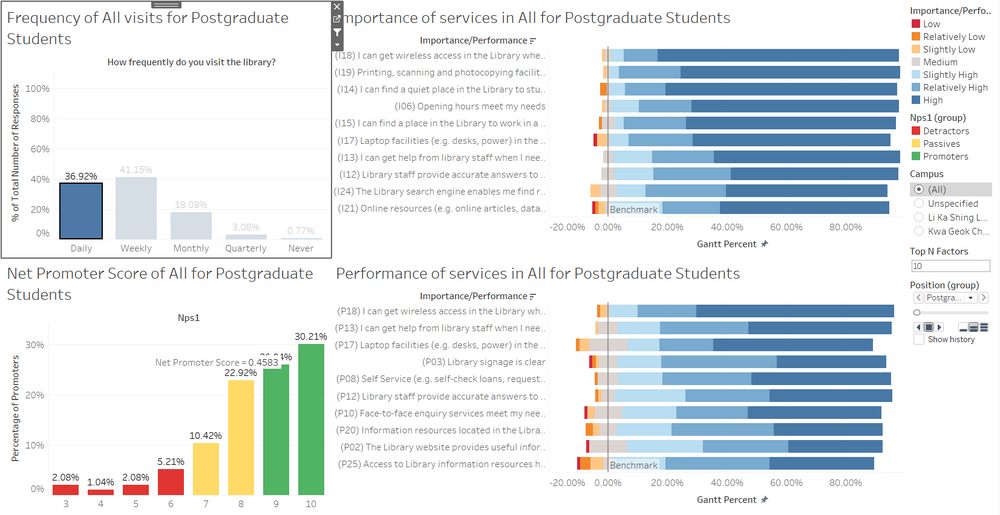
Here is an example of filtering by frequency of library visits. By clicking on the "Daily" bar, the other 3 visualisations have been changed to show only those responses where the respondents input "Daily" as their frequency of library visits.
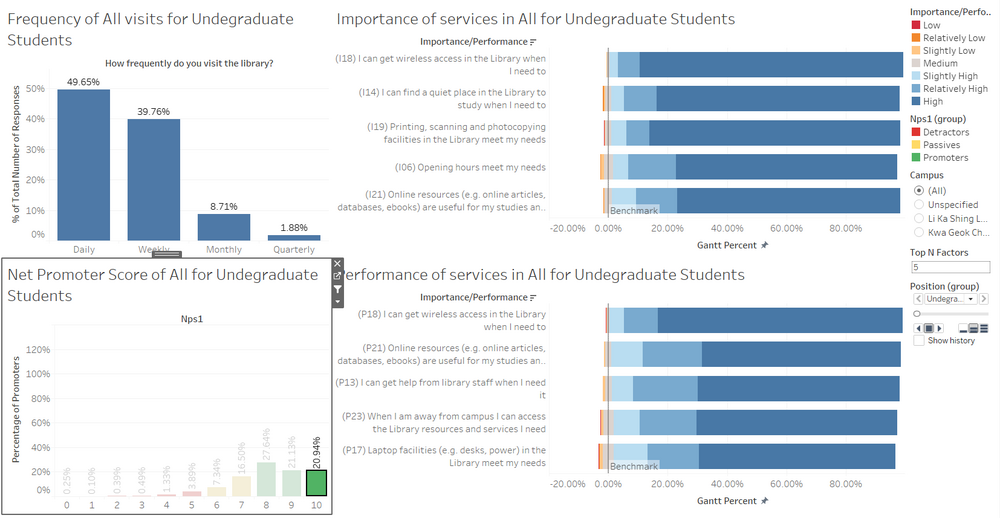
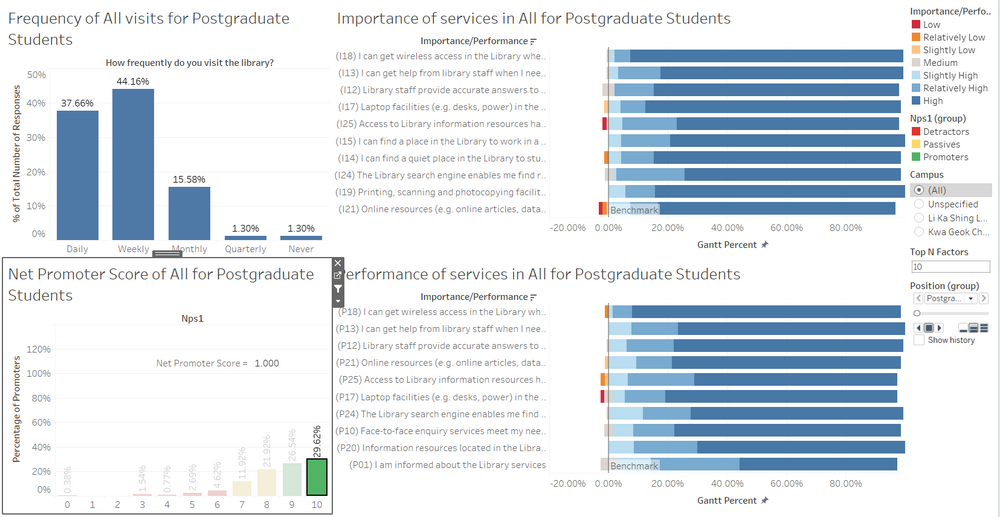
Similarly, this filters by Net Promoter Score. By clicking on the "10" bar, the other 3 visualisations have been changed to show only those Promoters who input "10" as whether they will recommend the Library.
Sorting
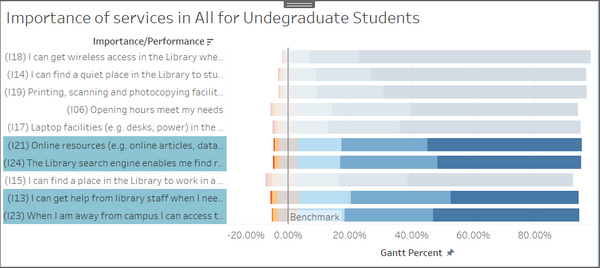
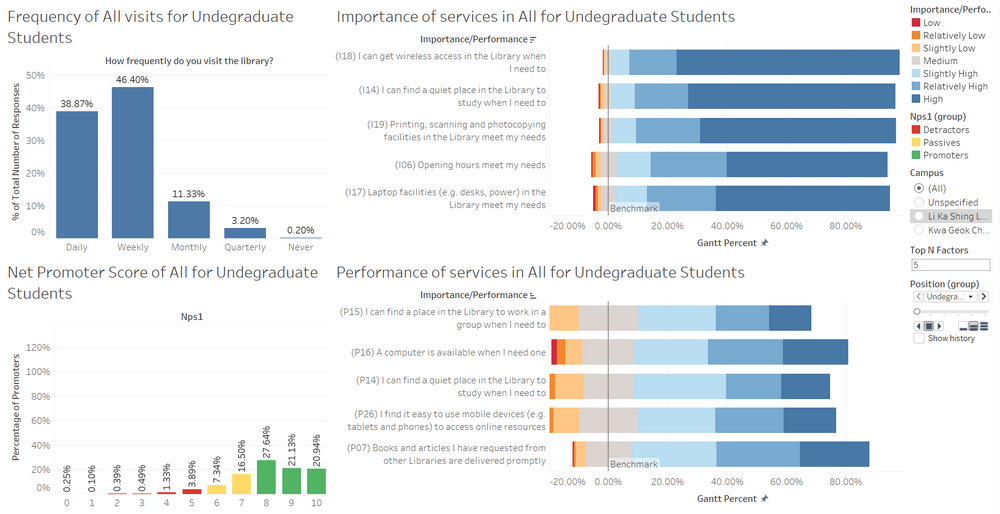
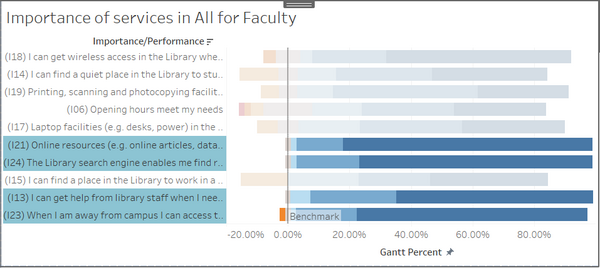
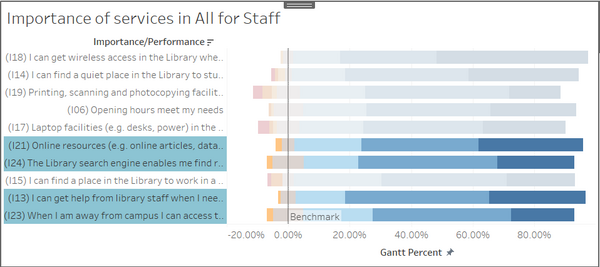
By default, both the Importance and Performance are sorted by descending order, meaning that the most important and best performed services are shown based on the Top N filter. We can show the least important and worst performed services by changing the sorting order on the chart.
Analysis & Insights
Undergraduate Students
Overall
This is the overview of the responses from all Undergraduate students across all years and both Libraries. From the frequency of library visits graph, most undergraduates visit the libraries either daily or weekly, with less than 15% for the other 3 options. Undergraduates as a whole have a Net Promoter Score of 28.28%, which is the lowest of all 4 groups of library users.
Top 5 most Important services are:
- I can get wireless access in the Library when I need to
- I can find a quiet place in the Library to study when I need to
- Printing, scanning and photocopying facilities in the Library meet my needs
- Opening hours meet my needs
- Laptop facilities (e.g. desks, power) in the Library meet my needs
Upon closer inspection, we can see that these facilities are available everywhere else in the school. Wireless access is available throughout Singapore Management University's grounds. Quiet places to study can be found in Group Study Rooms or Lounges across the 6 buildings. Printing, scanning and photocopying facilities are present in every faculty, with the exception of the newly constructed SMU Connexion. Most of SMU has long opening hours, with some Lounges open 24/7. Laptop facilities such as desks and power are widely available within each school. Hence, we can conclude that the services that are top rated in terms of importance apply to the rest of SMU as well.
When we expand the services to be analysed to 10, we can see that 4 of the 10 are unique to the Libraries. The most important that is unique to the Libraries is "Online resources (e.g. online articles, databases, ebooks) are useful for my studies and help me with my learning and research needs", which may mean that undergraduates frequently use online resources from the Libraries.
Top 5 best Performance services are:
- I can get wireless access in the Library when I need to
- I can get help from library staff when I need it
- Opening hours meet my needs
- Online resources (e.g. online articles, databases, ebooks) are useful for my studies and help me with my learning and research needs
- Library staff provide accurate answers to my enquiries
Of the 5 most important services, two of them are also in the top 5 best performing ones, namely "I can get wireless access in the Library when I need to" and "Opening hours meet my needs". The Libraries have done well in these services to comply to the needs of undergraduates.
Top 5 worst Performance services are:
- I can find a place in the Library to work in a group when I need to
- A computer is available when I need one
- I can find a quiet place in the Library to study when I need to
- I find it easy to use mobile devices (e.g. tablets and phones) to access online resources
- Books and articles I have requested from other Libraries are delivered promptly
Of the 5 most important services, one of them appear in the top 5 worst performing ones, namely "I can find a quiet place in the Library to study when I need to". The Libraries should look into providing more study spaces by better utilising the spaces in the Libraries so that more undergraduates are able to study in the Library when they need to.
Unsurprisingly, those who visit the Libraries on a daily basis have highly positive views of the Libraries, and hence the Net Promoter Score is increased.
Similarly, those who give positive reviews of the Libraries visit the Libraries very frequently, with most of them visiting daily.
Li Ka Shing Library
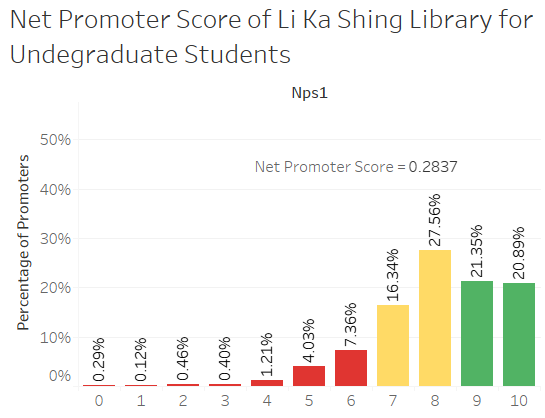
There is nothing too out of the ordinary for responses from Li Ka Shing Library, since they make up the large majority of the survey responses. The Net Promoter Score is higher for Li Ka Shing Library, which is slightly surprising since I would expect Li Ka Shing to be the worse-off due to it being largely crowded.
Kwa Geok Choo Library
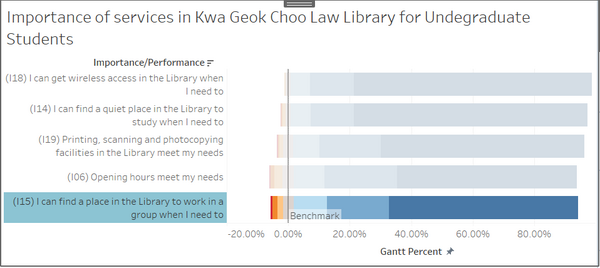
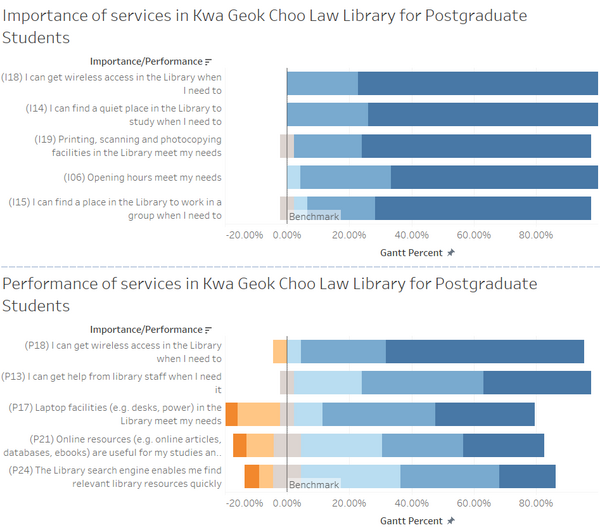
There is one service that is deemed as the Top 5 most important to respondents using Kwa Geok Choo Library compared to the overall consensus. From the service "I can find a place in the Library to work in a group when I need to" being one of the Top 5, it shows that undergraduates view Kwa Geok Choo Library to be a place for group discussions more so than Li Ka Shing Library.
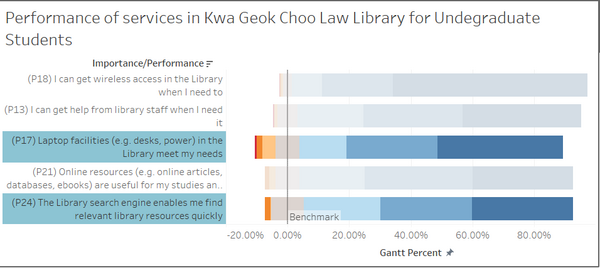
Performance-wise, two of the services are different from the overall consensus, namely "Laptop facilities (e.g. desks, power) in the Library meet my needs" and "The Library search engine enables me find relevant library resources quickly". One guess is that those at Kwa Geok Choo Library are there to search for materials and resources, hence they feedback that this is one of the areas that the Library has done well.
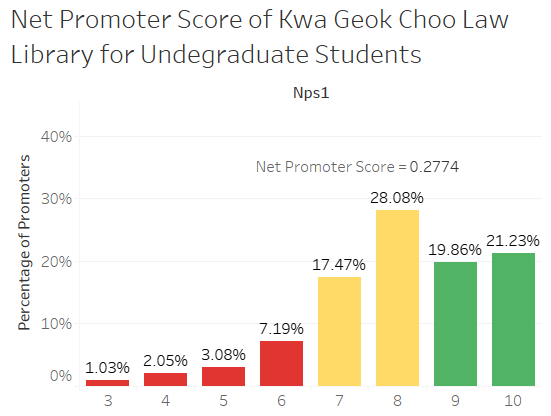
Interestingly, Kwa Geok Choo Library has a lower Net Promoter Score than Li Ka Shing Library according to undergraduates.
Postgraduate Students
Overall
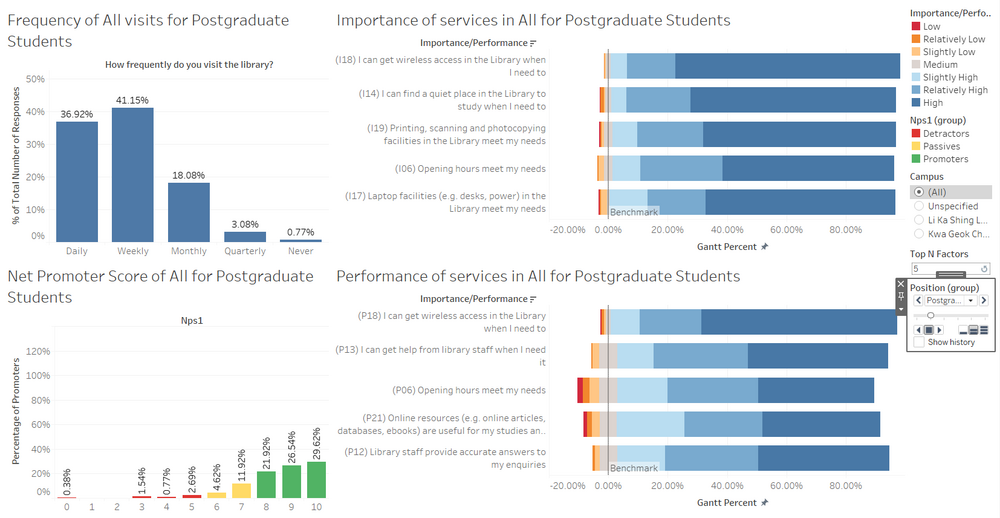
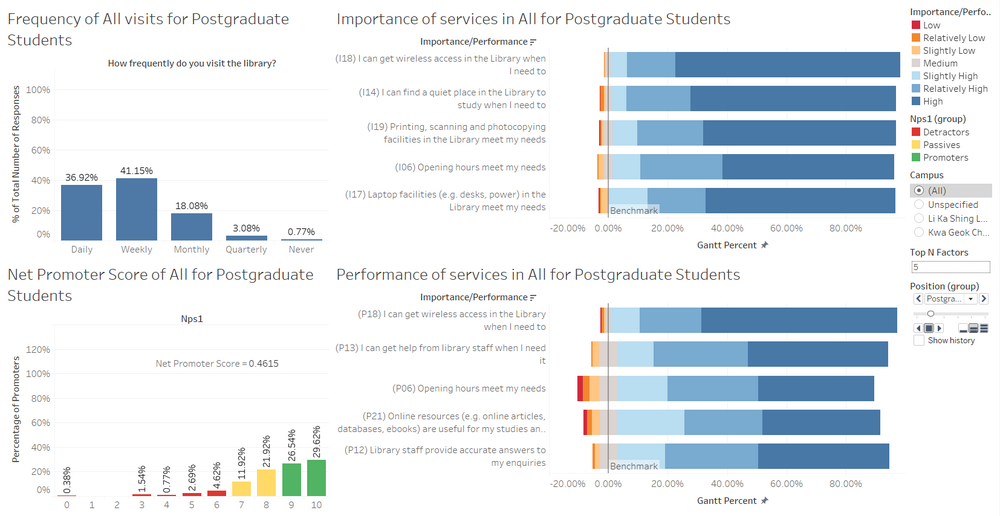
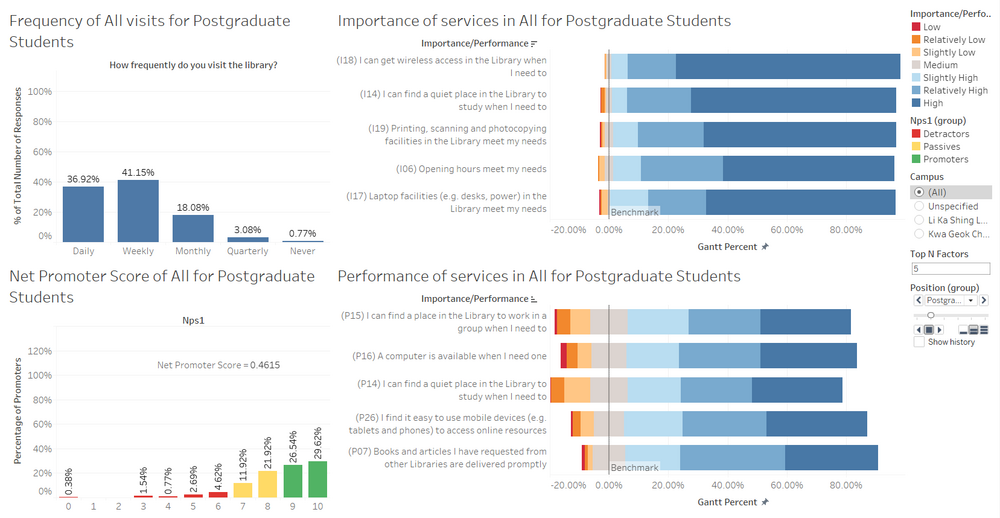
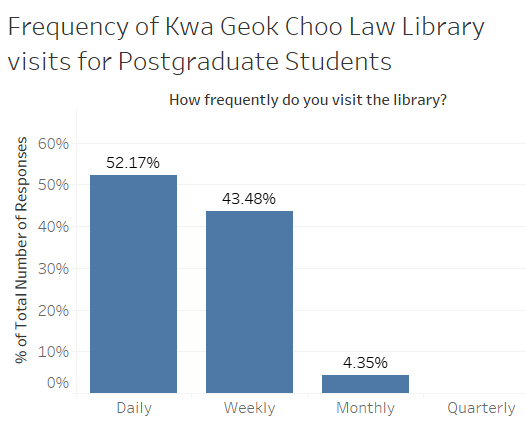
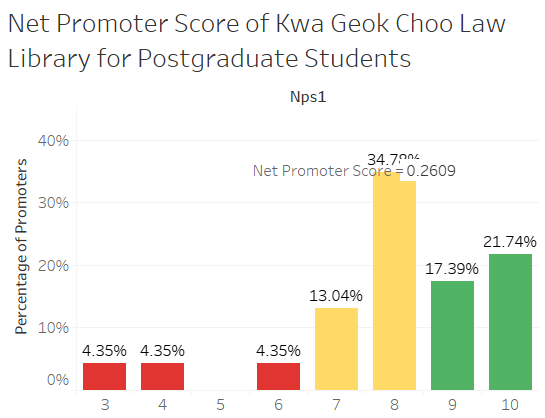
This is the overview of the responses from all Postgraduate students, including both Masters and Doctoral, and both Libraries. From the frequency of library visits graph, most undergraduates visit the libraries either daily or weekly as well, with slightly more than 20% for the other 3 options. Postgraduates as a whole have a Net Promoter Score of 46.15%, which is the second highest of all 4 groups of library users.
Top 5 most Important services are:
- I can get wireless access in the Library when I need to
- I can find a quiet place in the Library to study when I need to
- Printing, scanning and photocopying facilities in the Library meet my needs
- Opening hours meet my needs
- Laptop facilities (e.g. desks, power) in the Library meet my needs
These services are exactly the same as the ones chosen to be the most important by Undergraduates. From this, we can conclude that the services that are top rated in terms of importance are generally the same according to students.
Top 5 best Performance services are:
- I can get wireless access in the Library when I need to
- I can get help from library staff when I need it
- Opening hours meet my needs
- Online resources (e.g. online articles, databases, ebooks) are useful for my studies and help me with my learning and research needs
- Library staff provide accurate answers to my enquiries
Again, these are picked by Undergraduates as well.
Top 5 worst Performance services are:
- I can find a place in the Library to work in a group when I need to
- A computer is available when I need one
- I can find a quiet place in the Library to study when I need to
- I find it easy to use mobile devices (e.g. tablets and phones) to access online resources
- Books and articles I have requested from other Libraries are delivered promptly
And again, these services are the same as the ones chosen by Undergraduates. It appears that they must have had similar experiences using the Libraries.
Interestingly, the Net Promoter Score fell when filtered by those who visit the Libraries daily.
The distribution of the frequency of library visits appears to be more or less the same when filtered by those who rate it highly.
Li Ka Shing Library
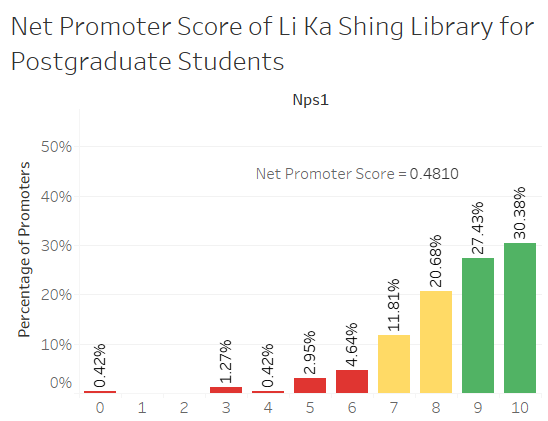
Similar to Undergraduates, there was nothing out of the ordinary with regards to Li Ka Shing Library. The Net Promoter Score soared for Postgraduates as well, and my guess would be the presence of a Lounge specifically dedicated to Postgraduates on the 5th floor of Li Ka Shing Library.
Kwa Geok Choo Library
For the services in Kwa Geok Choo Library, the Top 5 most important and best performing ones are the same as those indicated by Undergraduates.
It appears that users who go to Kwa Geok Choo Library more frequently likes to visit very often as well, with the majority of respondents being daily.
A large proportion of Postgraduates that go to Kwa Geok Choo Library tend to be Passives, while they are happy with the services there, they would not actively promote about Kwa Geok Choo to others.
Faculty
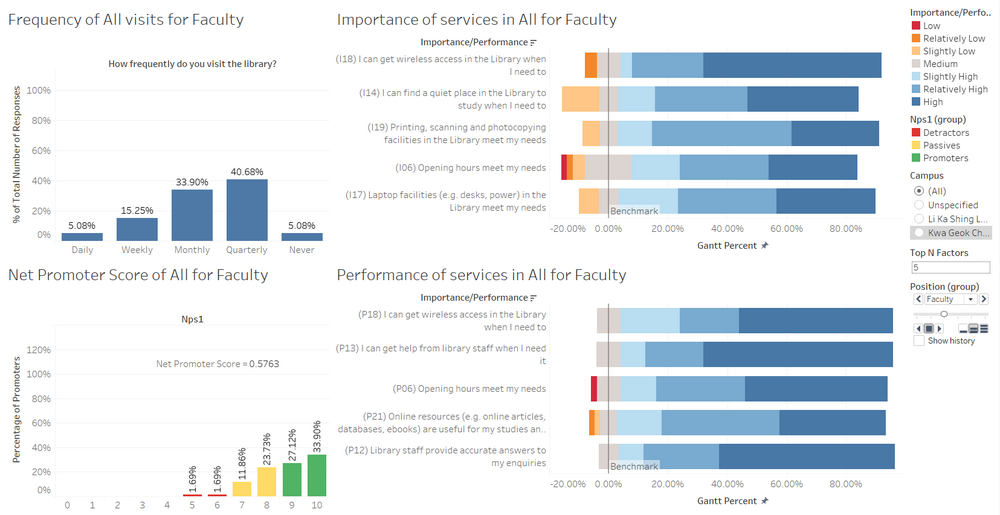
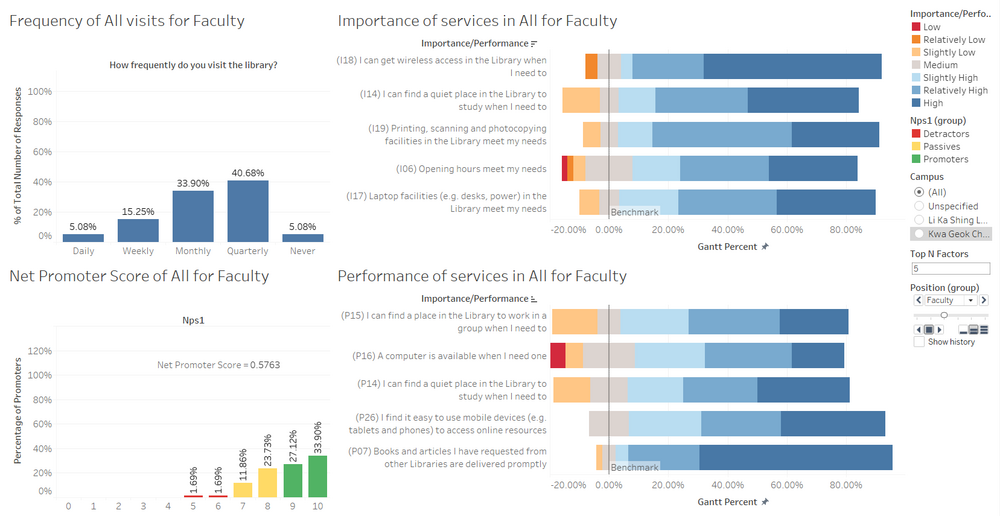
This is the overview of the responses from all Faculty members and both Libraries. From the frequency of library visits graph, most faculty visit the libraries very rarely, either monthly or quarterly, with about 20% for the other 3 options. Faculty as a whole have a Net Promoter Score of 57.63%, which is the highest of all 4 groups of library users.
Top 5 most Important services are:
- I can get wireless access in the Library when I need to
- I can find a quiet place in the Library to study when I need to
- Printing, scanning and photocopying facilities in the Library meet my needs
- Opening hours meet my needs
- Laptop facilities (e.g. desks, power) in the Library meet my needs
From this, it seems that there is a consensus between the three groups on what the most important services are.
Top 5 best Performance services are:
- I can get wireless access in the Library when I need to
- I can get help from library staff when I need it
- Opening hours meet my needs
- Online resources (e.g. online articles, databases, ebooks) are useful for my studies and help me with my learning and research needs
- Library staff provide accurate answers to my enquiries
Again, these are picked by students, both Undergraduates and Postgraduates as well.
Top 5 worst Performance services are:
- I can find a place in the Library to work in a group when I need to
- A computer is available when I need one
- I can find a quiet place in the Library to study when I need to
- I find it easy to use mobile devices (e.g. tablets and phones) to access online resources
- Books and articles I have requested from other Libraries are delivered promptly
It appears that despite the infrequency of their library use, the faculty have similar experiences and thoughts about the areas of service that needs improvement.
Li Ka Shing Library
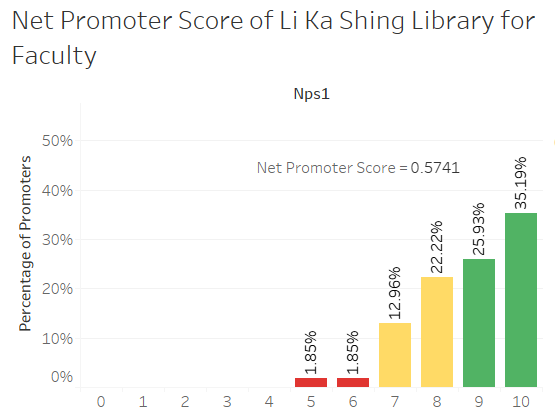
For Li Ka Shing Library, apart from the slight dip in Net Promoter Score, everything else is the same as the overall view of Faculty as a whole.
Kwa Geok Choo Library
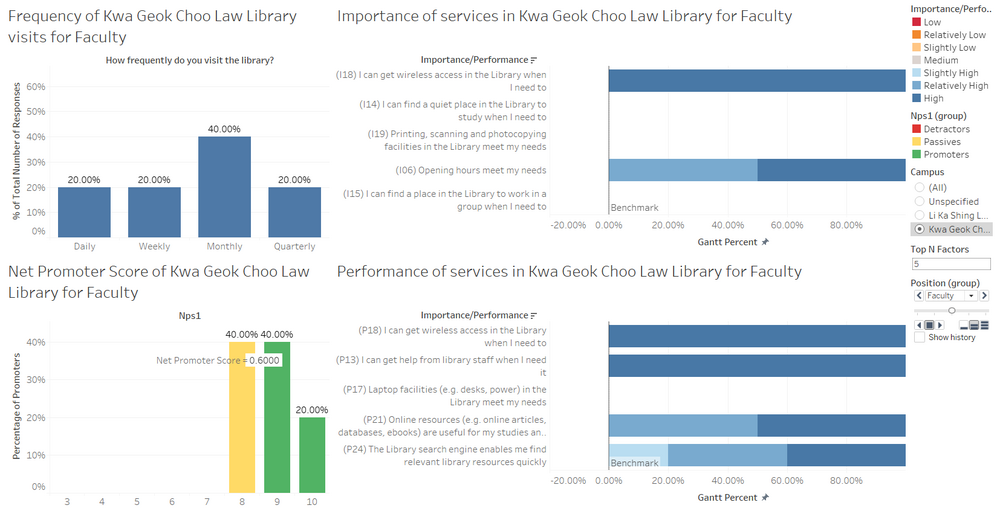
There are so little response for Kwa Geok Choo Library that the visualisation does not seem effective for it. This may also be the reason why the Net Promoter Score is so high for Kwa Geok Choo Library compared to Li Ka Shing Library.
Staff
Overall
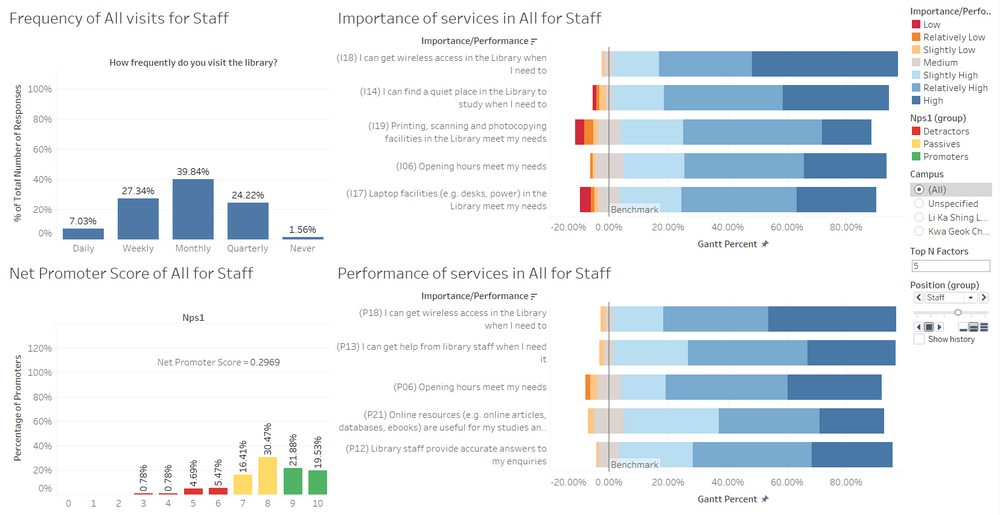
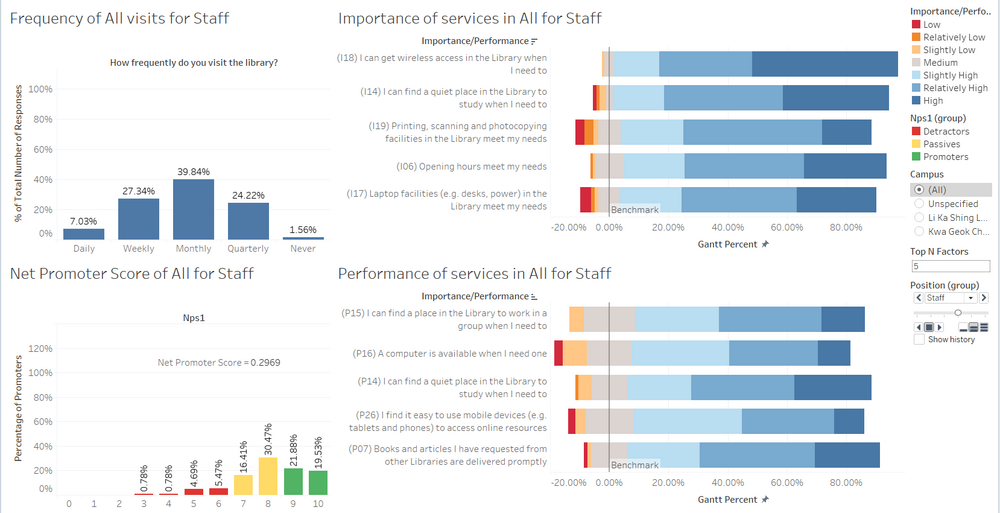
This is the overview of the responses from all Staff members and both Libraries. From the frequency of library visits graph, most faculty visit the libraries rarely, between weekly and quarterly, with less than 10% for the other 2 options. Staff as a whole have a Net Promoter Score of 29.69%, which is the second lowest of all 4 groups of library users.
Top 5 most Important services are:
- I can get wireless access in the Library when I need to
- I can find a quiet place in the Library to study when I need to
- Printing, scanning and photocopying facilities in the Library meet my needs
- Opening hours meet my needs
- Laptop facilities (e.g. desks, power) in the Library meet my needs
Much to my surprise, all 4 groups of users stated the same Top 10 most important factors.
Top 5 best Performance services are:
- I can get wireless access in the Library when I need to
- I can get help from library staff when I need it
- Opening hours meet my needs
- Online resources (e.g. online articles, databases, ebooks) are useful for my studies and help me with my learning and research needs
- Library staff provide accurate answers to my enquiries
Again, these are the same as the other 3 groups.
Top 5 worst Performance services are:
- I can find a place in the Library to work in a group when I need to
- A computer is available when I need one
- I can find a quiet place in the Library to study when I need to
- I find it easy to use mobile devices (e.g. tablets and phones) to access online resources
- Books and articles I have requested from other Libraries are delivered promptly
All 4 groups have similar thoughts on the Library services. The Library should take this into account and improve the Top 5 worst performing services to cater to the needs of all 4 groups of respondents.
Li Ka Shing Library
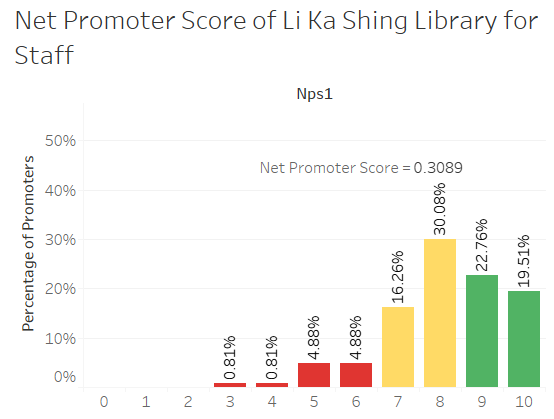
For Li Ka Shing Library, there is a slight increase in Net Promoter Score compared to the overall figures.


