IS428 AY2019-20T2 Assign CHUA MING YU
IS428 Visual Analytics for Business Intelligence
Overview
Every two years, SMU Libraries conduct a comprehensive survey in which faculty, students and staff have the opportunity to rate various aspects of SMU library's services. The survey provides SMU libraries with input to help enhance existing services and to anticipate emerging needs of SMU faculty, students and staff.
The interactive tableau chart can be found at here [1]
Data Preperation
Tableau Prep was used to process the data given in "Raw data 2018-03-07 SMU LCS data file - KLG.xlsx"
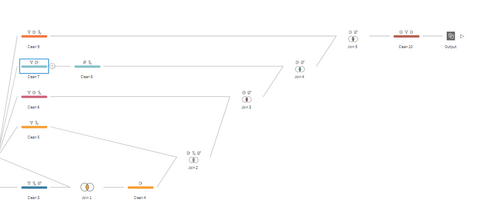
The overall steps look like:
Below will be a step by step guide of what I did to get the final output.
| Screenshot | Steps |
|---|---|
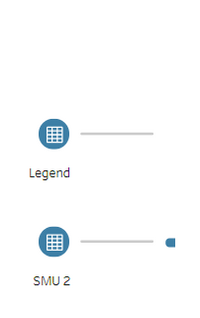
| I added both sheets into tableau prep | |
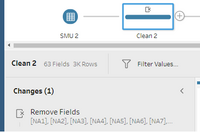
| I removed all the responses where respondents responded that it is not applicable to them | |
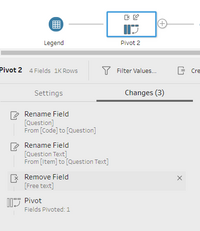
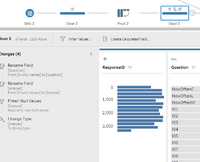
| I pivoted the values so that instead of having multiple responses to multiple questions in one row, each row will represent one response to one question | |
| I renamed several columns so that the headers have more meaning. Then I pivoted it so that there will be one row per question and answer. | |
|
|
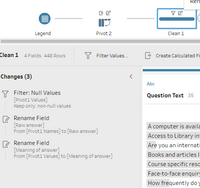
I filtered out all the null values that appear due to the previous pivot step. |
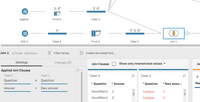
| I did an inner join on both sheets so that I can get all the responses and their corresponding meaning | |
| I used a whole bunch of merge statements to replace the responses for Position, StudyArea, ID, Campus. This allows for the values to have meaning instead of staying as numbered responses. |

