IS428 AY2019-20T2 Assign RYAN WONG POH FAI
Revision as of 11:36, 15 March 2020 by Ryan.wong.2016 (talk | contribs)
Data Preparation
For Data Preparation, I referred to the following video for some guidance.
Data Cleaning and Transformation
| Screenshots | Steps |
|---|---|
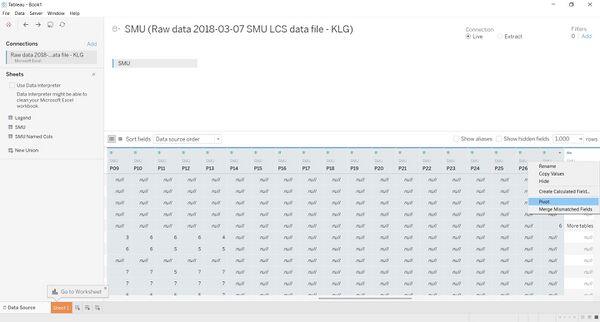
| 1. Pivot I01-I26, P01-P27 | |
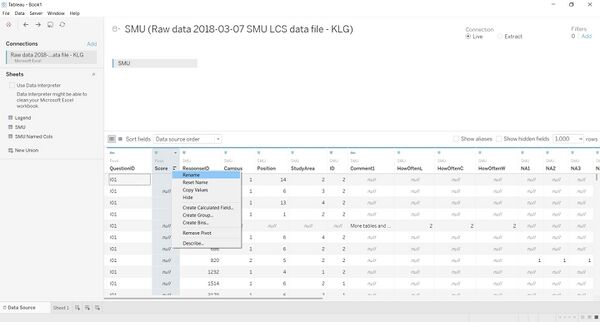
| 2. Rename Pivot Field Names and Pivot Field Values to "QuestionID" and "Score" respectively | |
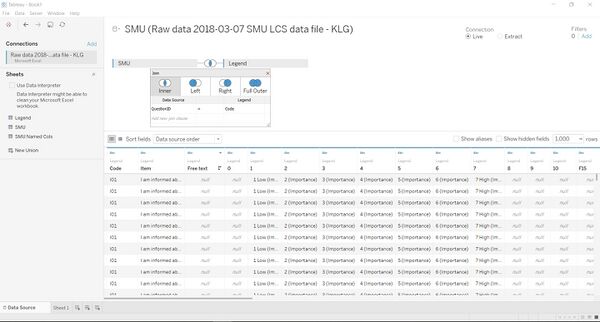
| 3. Drag Legend and Inner Join with SMU tab (QuestionID = Code) | |
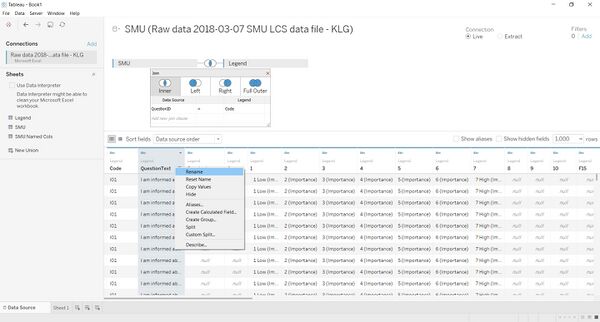
| 4. Rename Item Column to QuestionText | |
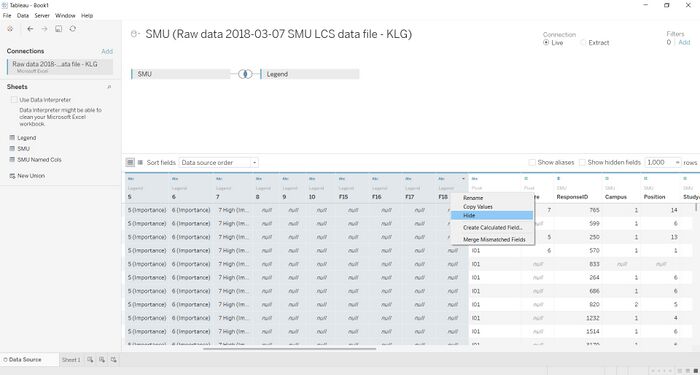
| 5. Hide Columns: Code, Free text, 0-10, F15-F18 | |
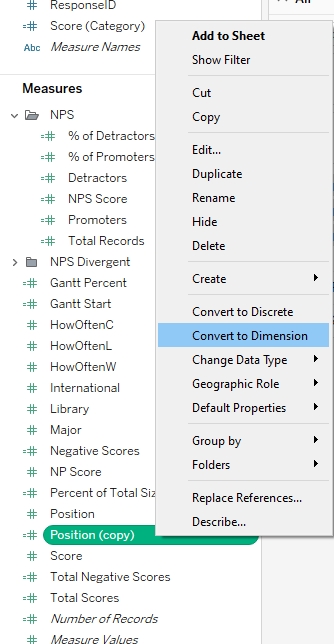
| 6. In a new Sheet, Duplicate Position under Measures > Rename it as Position (Category) | |
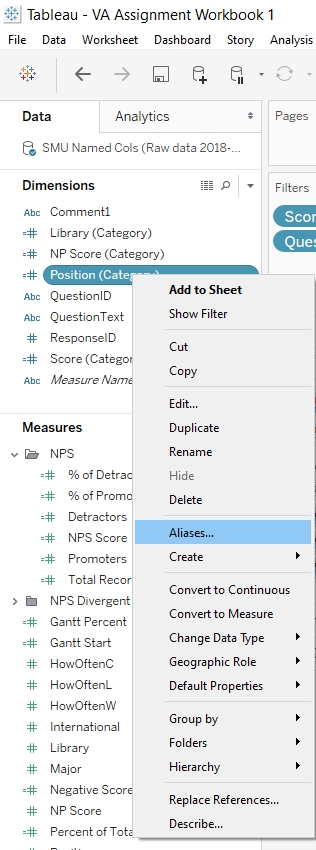
| 7. Create Aliases for Position | |
| 8. Rename Aliases for Position | |
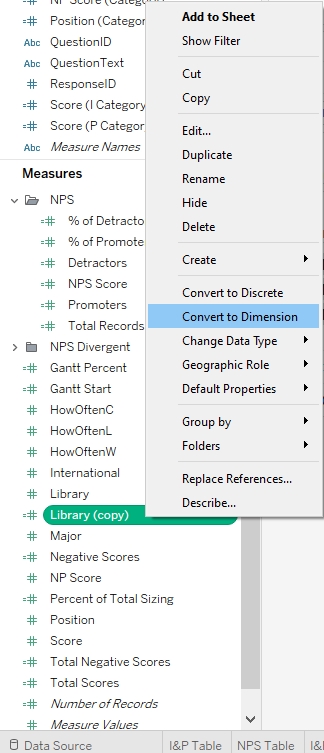
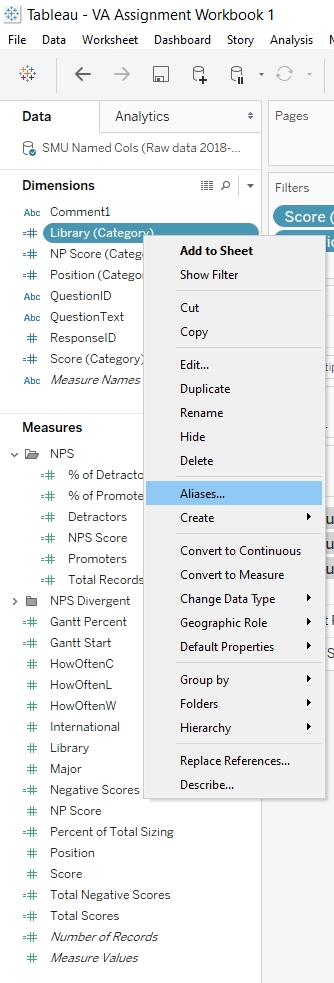
| 9. Duplicate Library under Measures > Rename it as Library (Category) | |
| 10. Create Aliases for Library | |
| 11. Rename Aliases according to the screenshot | |
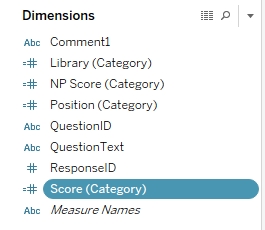
| 12. Under Measures, duplicate Score and convert it to a dimension
13. Then, rename the Score dimension to "Score (Category)" |
Comments on Survey
One issue with the Library Survey is that it does not assign a description to each score. The Survey only gave a description of Low for a score of 1, and a description of High for a score of 7. The Survey should improve on this by providing descriptions for each score. An example given:
| Score | Description |
|---|---|
| Not important at all / Not satisfied at all | |
| Not important / Not satisfied | |
| Slightly not important / Slightly unsatisfied | |
| Neutral | |
| Slightly important / Slightly satisfied | |
| Important / Satisfied | |
| Extremely Important / Extremely satisfied |
By providing descriptions, survey respondents will have a better idea of what each score represents. Therefore, for the purposes of analysing this survey, I will assume that the scores follow the table above.
