IS428 AY2019-20T2 Assign ARINO ANG JIA LER
Contents
Overview
Background
Every two years, SMU Libraries conduct a comprehensive survey in which faculty, students and staff have the opportunity to rate various aspects of SMU library's services. The objective of the survey is to provide these libraries with input to help improve existing services as well as information regarding anticipating emerging needs of SMU faculty, students (undergraduates and postgraduates), and staff. The latest survey ended on 17th February 2020. The past reports are mainly made-up of large numbers of pages of tables, which are difficult to comprehend. The difficulty in comprehension has resulted in the inability to draw useful information that could help SMU Libraries in making the necessary improvements or changes.
Objective
The aim of this project is to design a better dashboard/report that would allow SMU Libraries to extract valuable insights from the perspective of undergraduate students, postgraduate students, faculty, and staff. The dashboard designs would mainly surround the responses of each assessment item in the survey (e.g. services provided by the library) as well as the net promoter score. There would also be some focus on the sub-attributes of people who provide certain responses (e.g. attributes of respondents who are unhappy with a certain service provided by the library).
Data preparation
Dataset
The dataset provided in this project is the 2018 Library Survey dataset. In this dataset, there are 89 variables and 2639 responses. 26 of the 88 variables are not applicable (NA01 – NA26), thus, we are excluding these 26 variables. There is 1 identifier variable used to uniquely identify each response (ResponseID)
For the remaining 62 variables, 26 of them measures the importance of each assessment (i01 – i26), and the other 26, based on the same questions, measures the performance of each assessment (P01 – P26). There is 1 variable on overall satisfaction of the library, measured using performance as well (P27). All assessment variables are based on Likert Scale data.
The remaining 9 variables provides information on respondent behaviour (Campus, HowOftenL, HowOftenC, HowOftenW), characteristics (StudyArea, Position, ID), net promoter score (NPS1) and an open-ended comment section (Comment1).
Data cleaning & transformation
| Screenshots | Description |
|---|---|
|
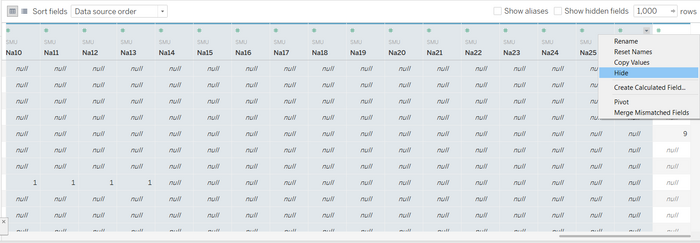
Figure 1.0: Hiding of columns |
|
|
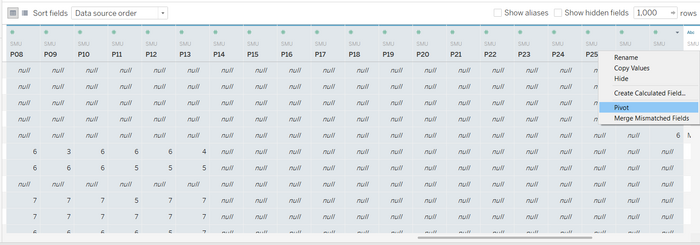
Figure 2.0: Pivoting of Columns |
|
|
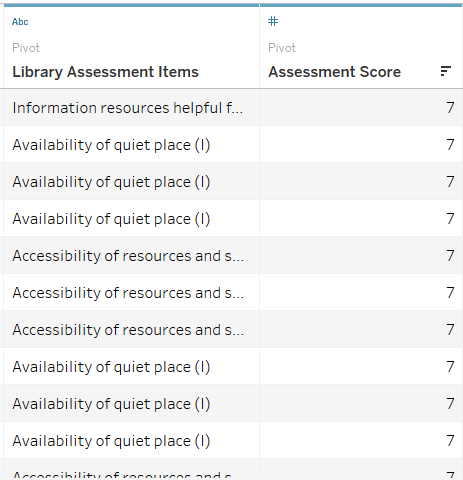
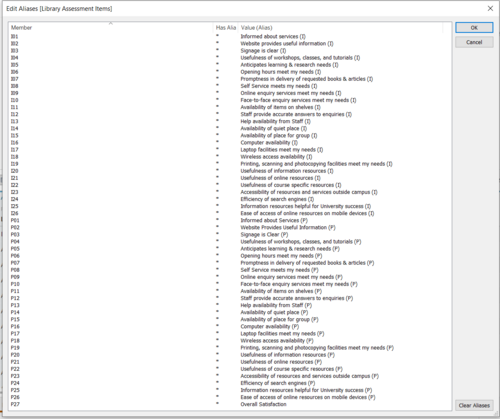
Figure 3.0: Renamed Columns Figure 3.1: Aliases for Assessment Items |
|
|
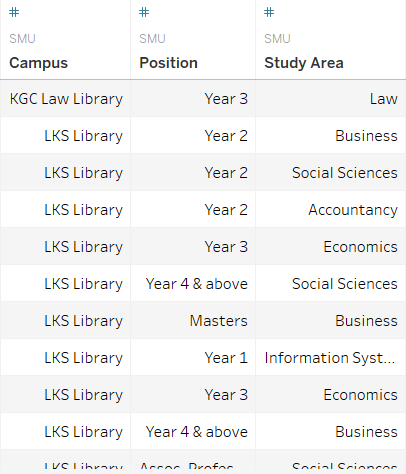
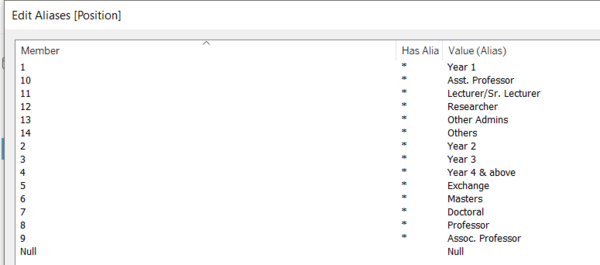
Figure 4.0: Columns with new Aliases Figure 4.1: Aliases for Campus Figure 4.2: Aliases for Position Figure 4.3: Aliases for Study Area |
|
|
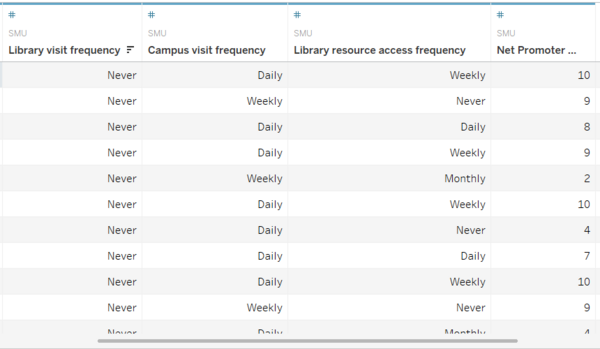
Figure 5.0: Renamed Columns Figure 5.1: Aliases for 3 values of frequency |
|
|
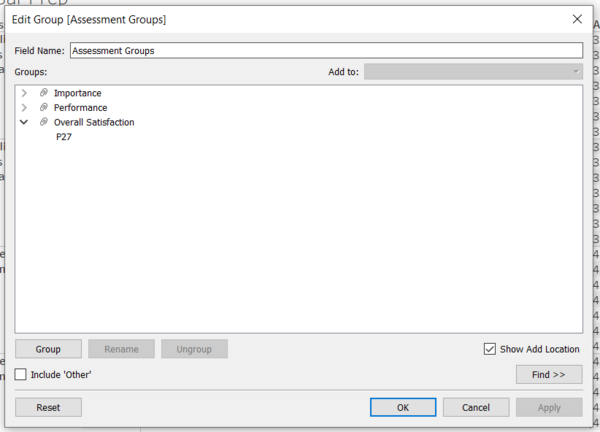
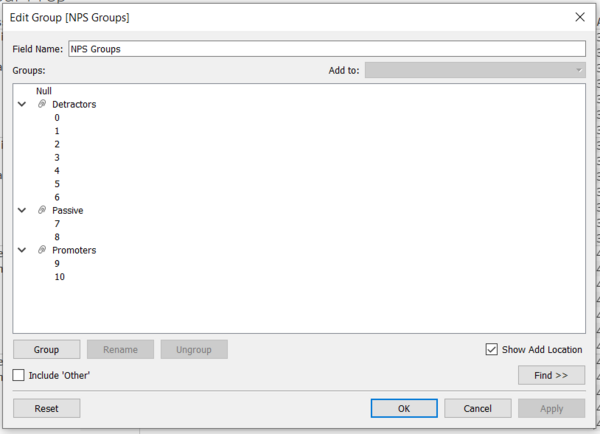
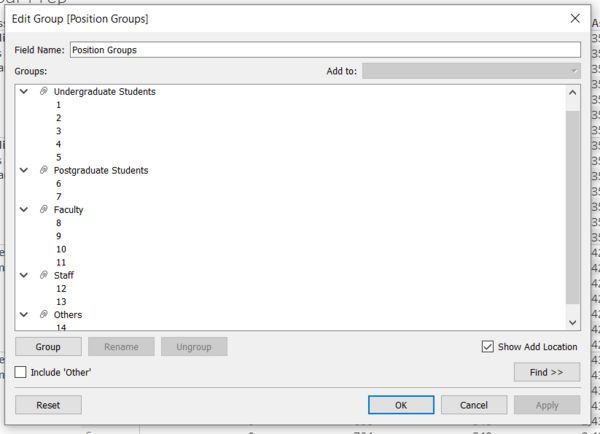
Figure 6.0: Groups for Library Assessment Items Figure 6.1: Groups for Net Promoter Score Figure 6.2: Groups for Position |
|
|
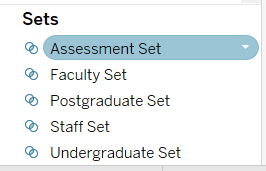
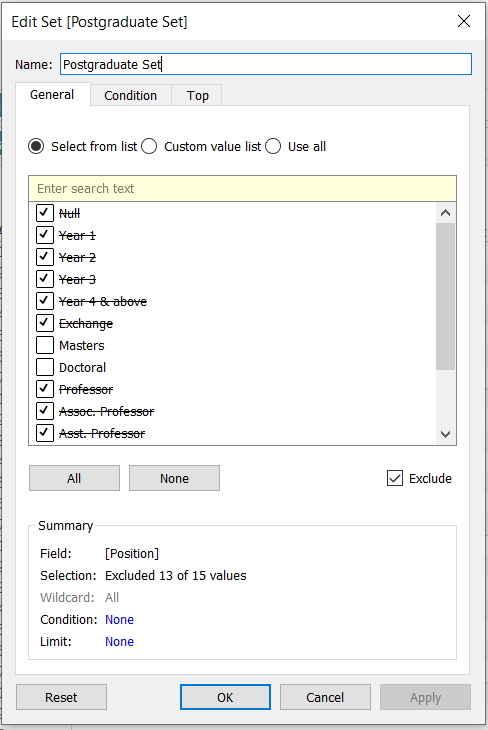
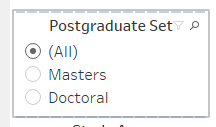
Figure 7.0: Collection of Sets Figure 7.1: Sample of a set using Postgraduate Figure 7.2: Sample of filter interface using Postgraduate Set |
|
|
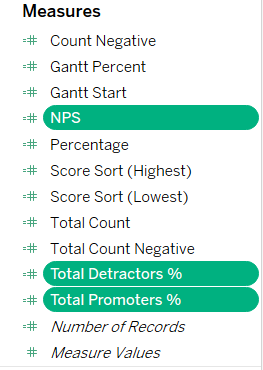
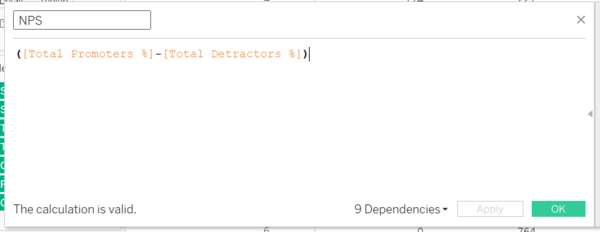
Figure 8.0: The 3 new measures created for NPS Figure 8.1: Formula for Detractors Figure 8.2: Formula for Promoters Figure 8.3: Formula for NPS |
|
|
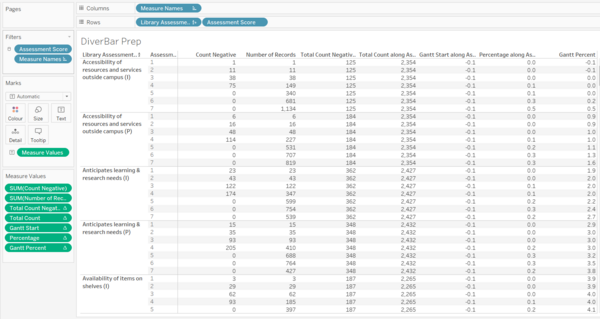
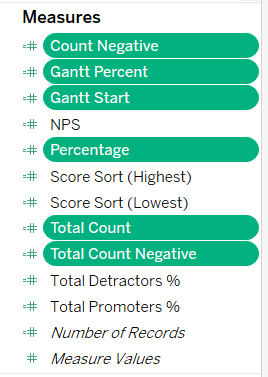
Figure 9.0: Sheet used for creation and verification of Diverging stacked bar chart variables Figure 9.1: Collection of Measures created for the Diverging stacked bar chart |
|
|
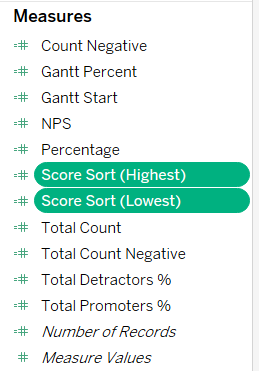
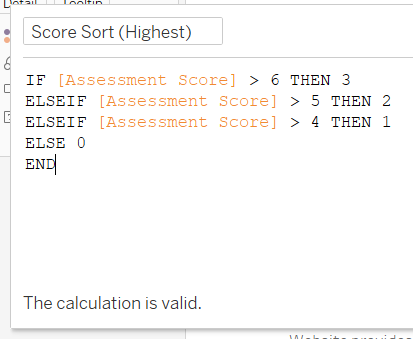
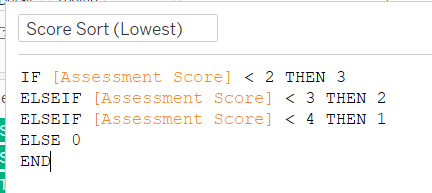
Figure 10.0: Collection of Sorting variables Figure 10.1: Formula for Score Sort (Highest) Figure 10.2: Formula for Score Sort (Lowest) |
|
|
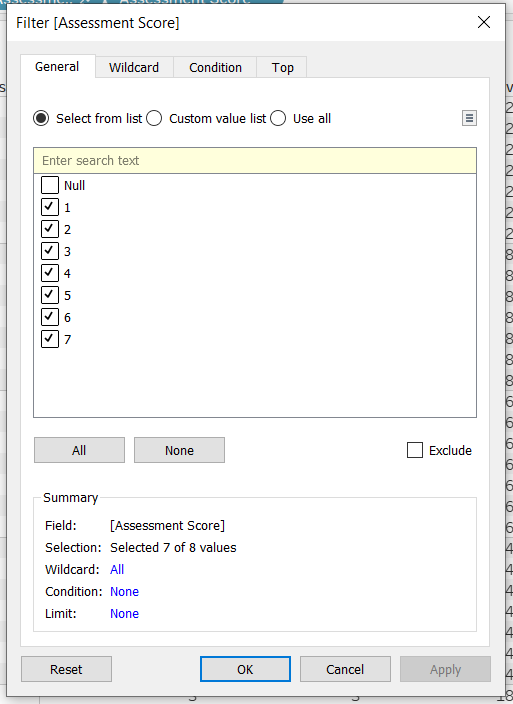
Figure 11.0: Global filter for the entire Dashboard |
|
Dashboard
Storyboard Link
Link to storyboard: https://public.tableau.com/profile/arino#!/vizhome/IS428_Assignment_Tableau_Arino/Storyboard
Storyboard Overview
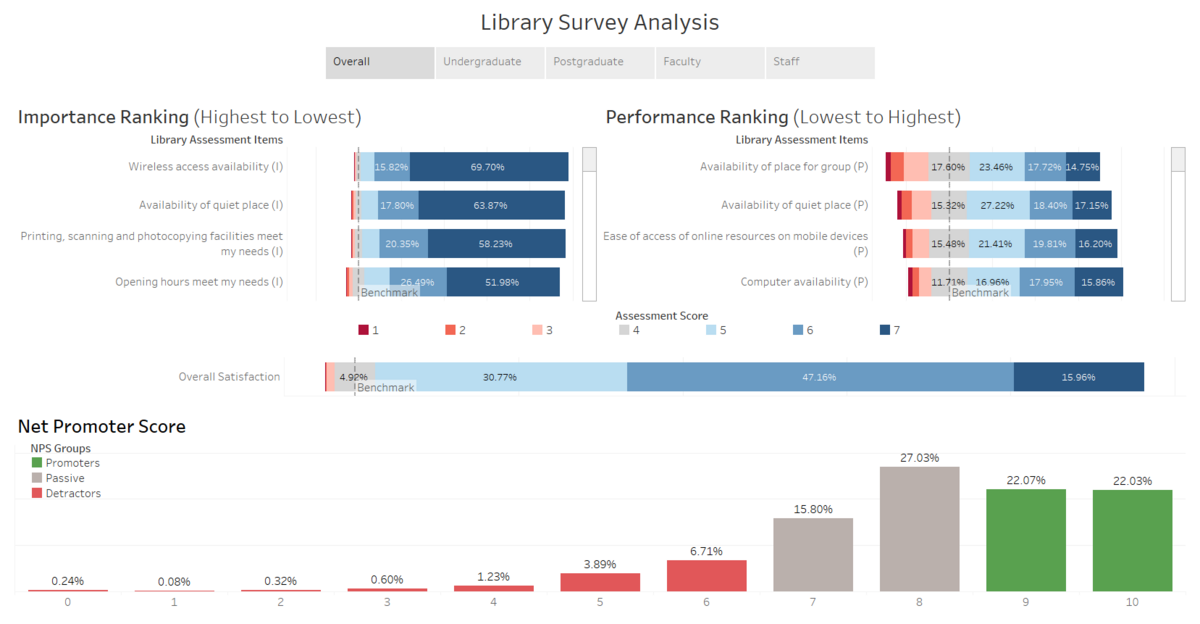
Overall level of service
Overall Satisfaction of Library
Importance ranking of Assessment Items
Performance ranking of Assessment Items
Net Promoter Score
Levels of service perceived by each Group
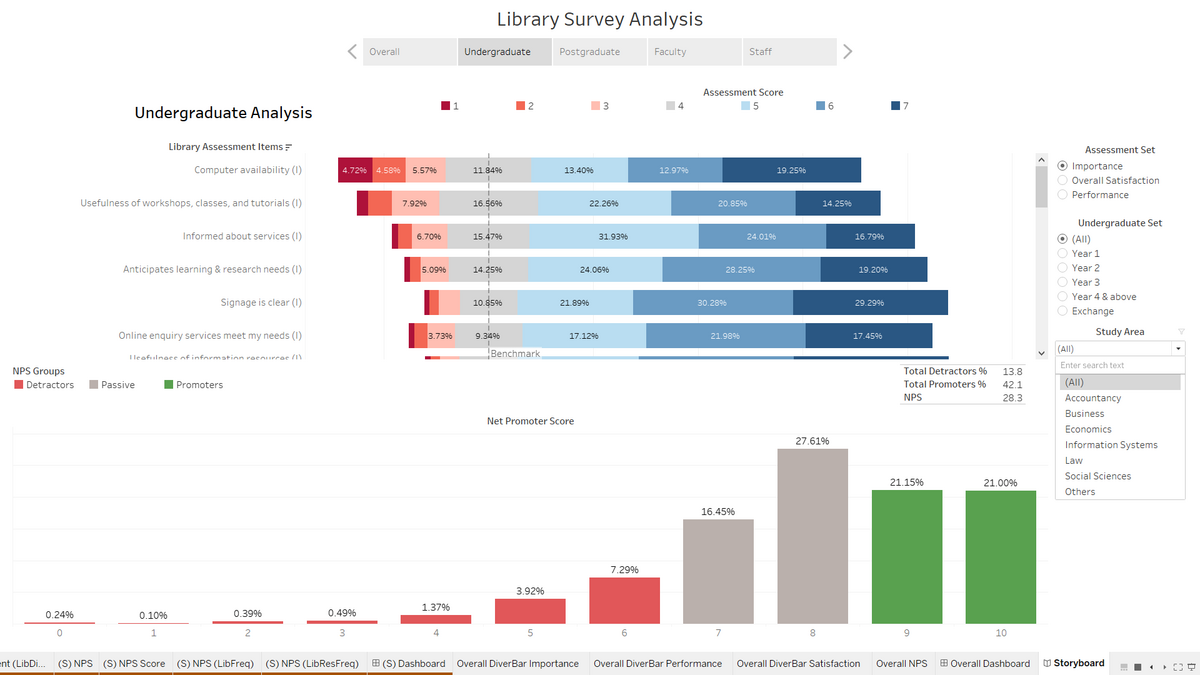
Undergraduates
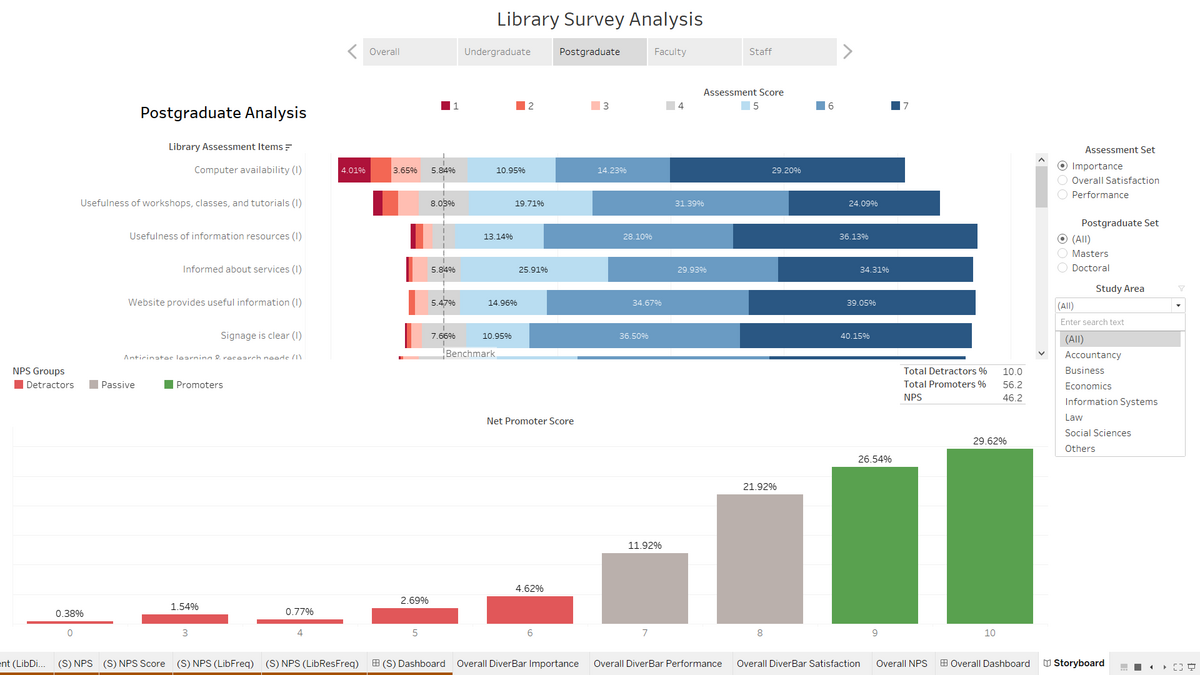
Postgraduates
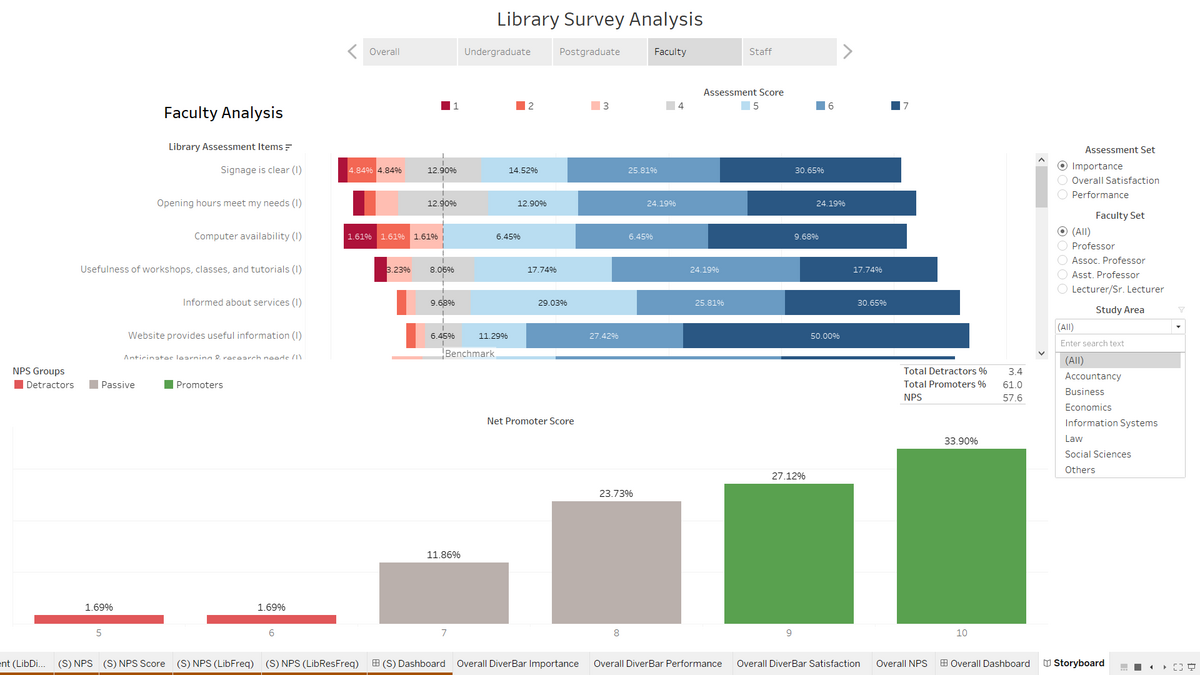
Faculty
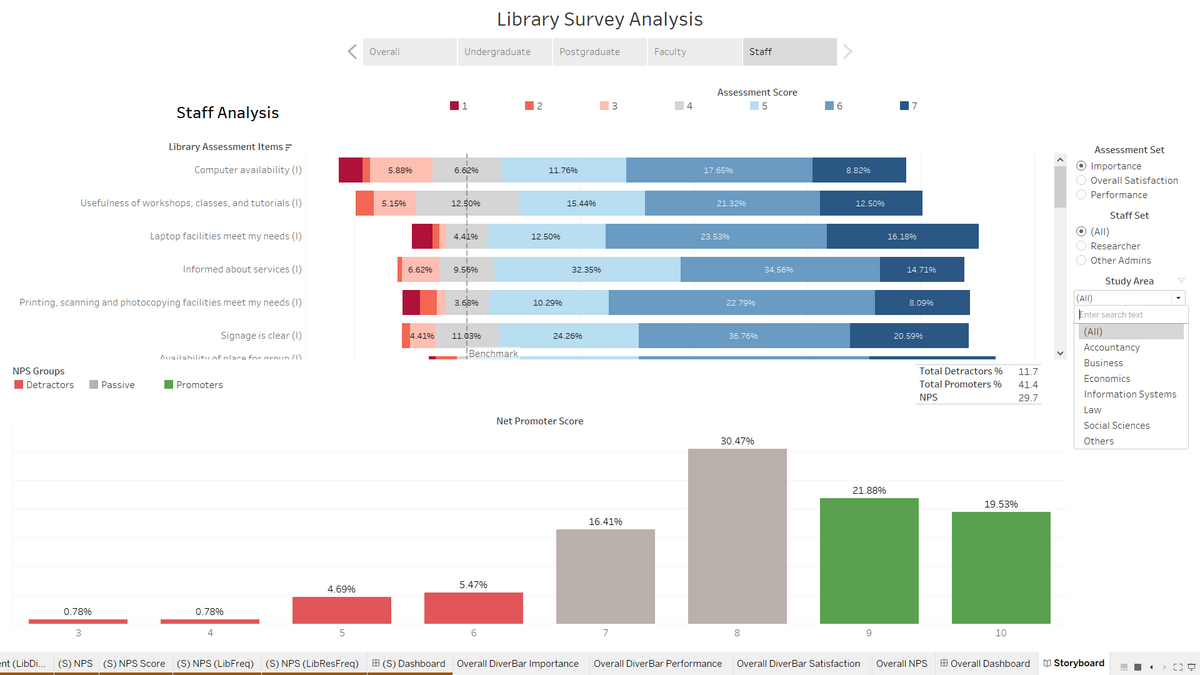
Staff
Additional Tooltips
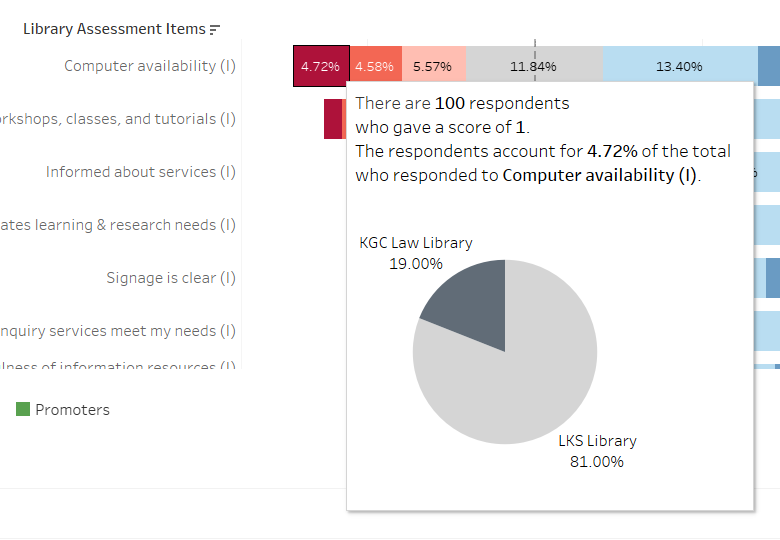
Tool tip 1: KGC vs LKS library frequency
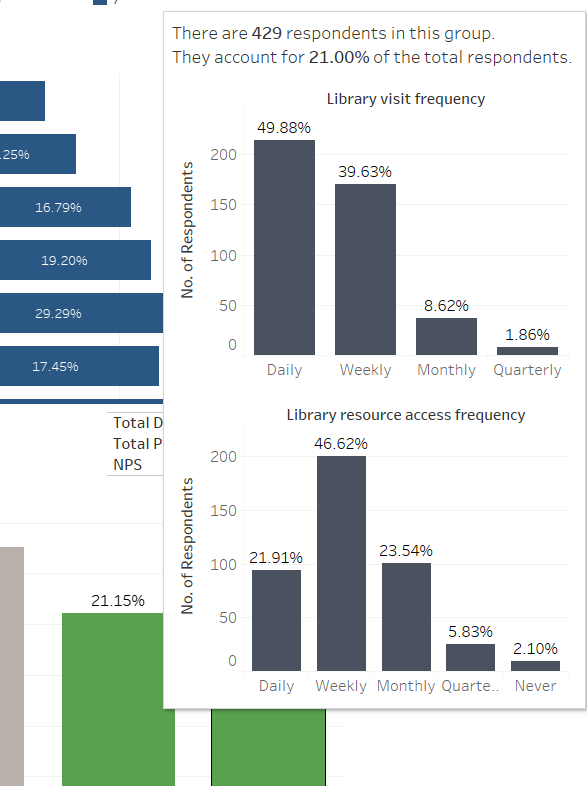
Tool tip 2: Library Utilization
Analysis & Insights
For the following sections, we would explore the data based on each major group of library users. However, there would be some cross referencing and comparison across the major groups. There would also be different levels of analysis for each major group or subgroup depending on what is relevant.
Undergraduate Students
Importance
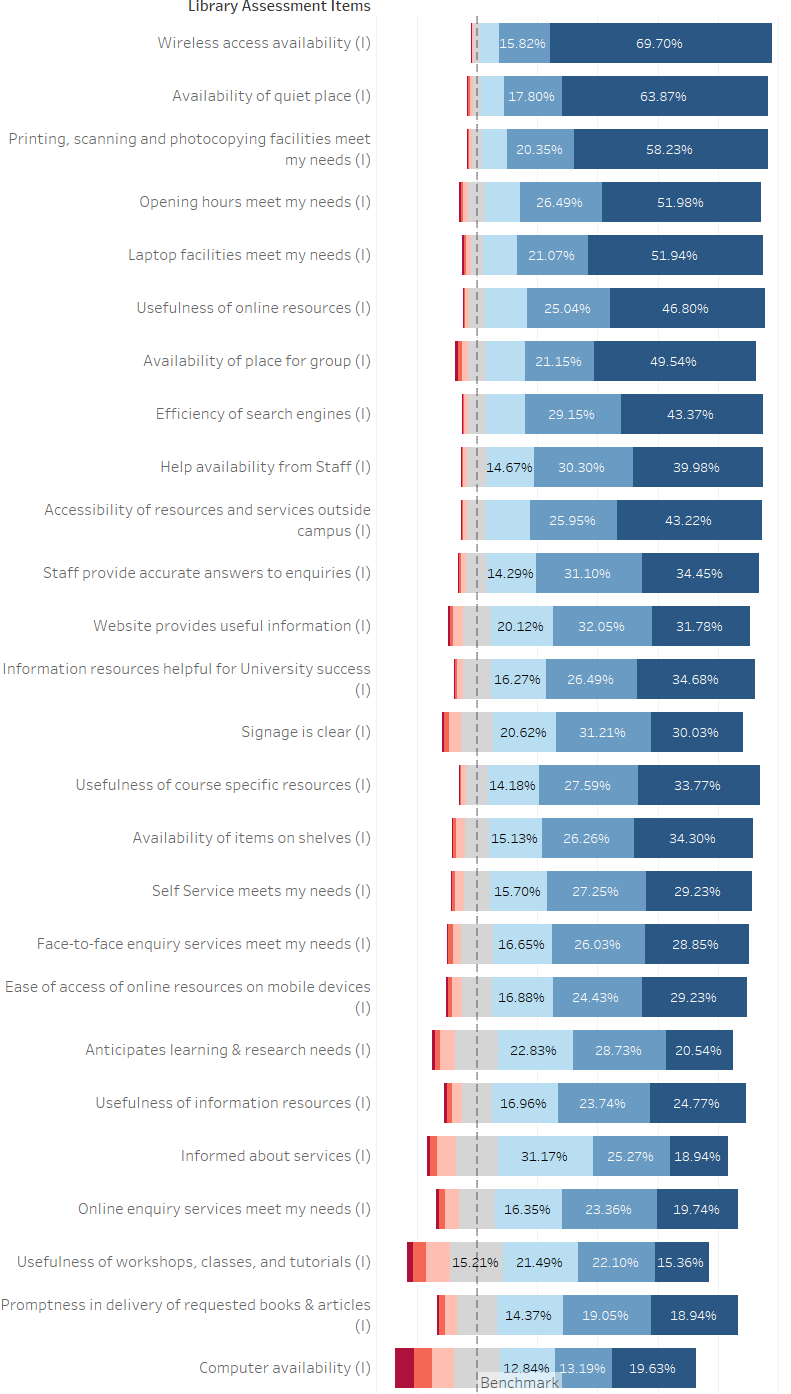
As the chart can be sorted based on highest positive assessment scores with greater weight given to higher scores (e.g. Assessment Score 7 is assumed to invoke stronger positive feelings that Assessment Score 5 which is close to neutral), we rank the importance of library elements.
The top 5 most important library elements as seen in the chart above are (~ = approximately):
- Wireless access availability
- ~ 97% students indicated important
- Availability of quiet place
- ~ 95% students indicated important
- Printing, scanning and photocopying facilities
- ~ 95% students indicated important
- Opening hours
- ~ 91% students indicated important
- Laptop facilities – such as desk and power
- ~ 93% students indicated important
The top 5 elements indicate that Undergraduates generally view and make use of the library as they would with any other facilities in Singapore Management University (SMU). For example, there are wireless access availability, quiet places, printing, scanning and photocopying facilities, laptop facilities, and opening hours mandated around SMU. This mean that whatever is viewed as important to undergraduate students about the library, is currently being offered everywhere in the school. There is nothing in the top 5 most important elements, rated by students, that is uniquely offered by only SMU libraries and not anywhere else in the school.
Things that are uniquely offered by SMU libraries could be online resources provided by the library, which is currently rank 7 on the list as seen in the above chart.
I have highlighted in the chart above, the overall top 5 most important library elements. The top 5 is generally the same for all undergraduates with an exception of Year 1 students as seen in the chart above. Availability of place to work in a group has joined the ranks of being the top 5 most important elements of SMU libraries, it is circled in red. We can make the inference that Year 1 students tend to view the library as a place for group meetings.
Apart from Year, the results also vary across Study Areas. The highlighted charts are the overall top 5 most important library elements. As seen in the chart above, Law students tend to also view the library as a place for offline materials (Availability of items on shelves) as well as to search for library resources (Efficiency of search engines) these elements are circled in red.
Things that are uniquely offered by SMU libraries are important to students studying Law. Perhaps, the Kwa Geok Choo Law Library could place a heavier emphasis on their offline materials as well as ensuring that their search engines are able to quickly and accurately retrieve law related online materials.
The results are also similar for student in Social Sciences where there is heavy importance placed on availability of offline materials as well as efficiency of search engines. Both offline and online materials are relatively more important for students studying Law and Social Sciences than any other Study Areas. The Libraries could possibly put more emphasis on procuring materials that are in those two fields than other areas of study.
Performance
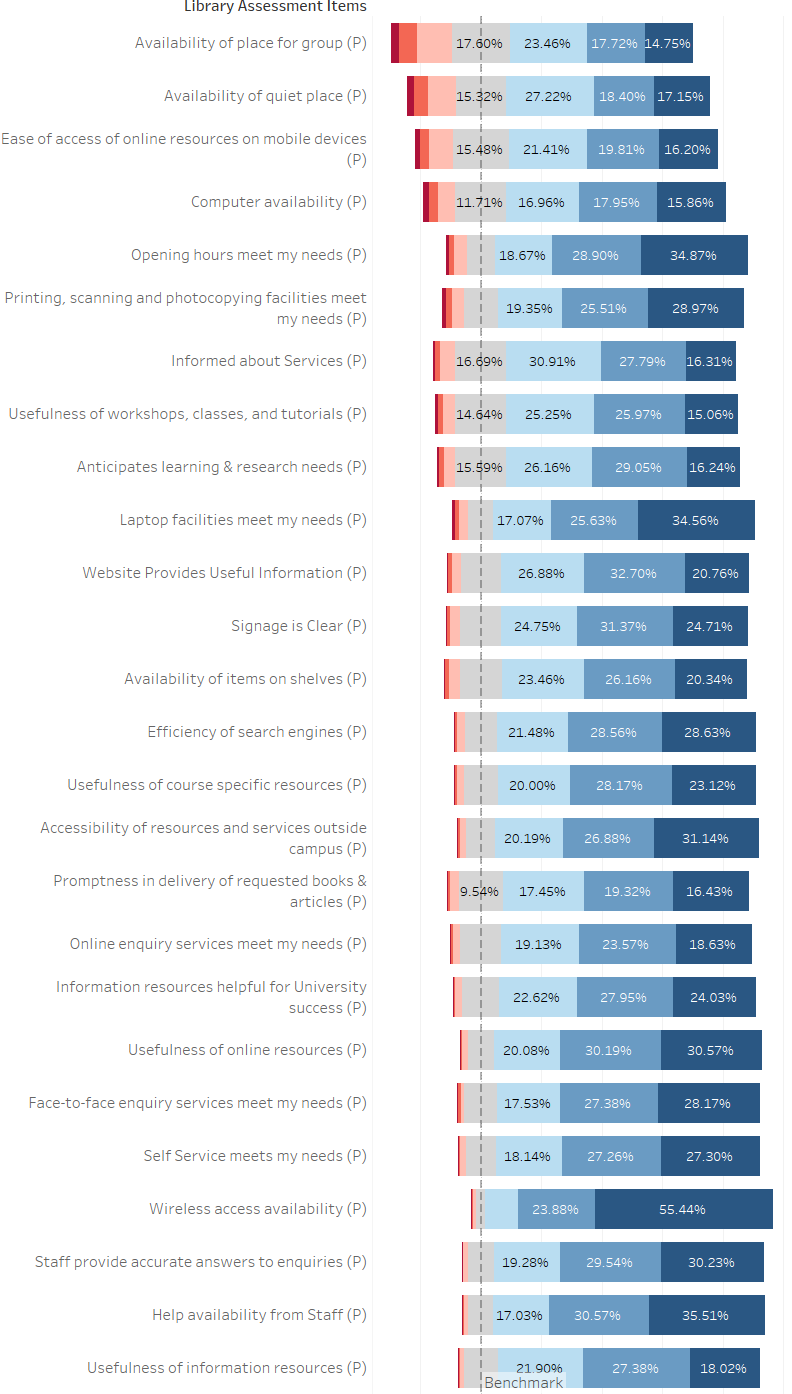
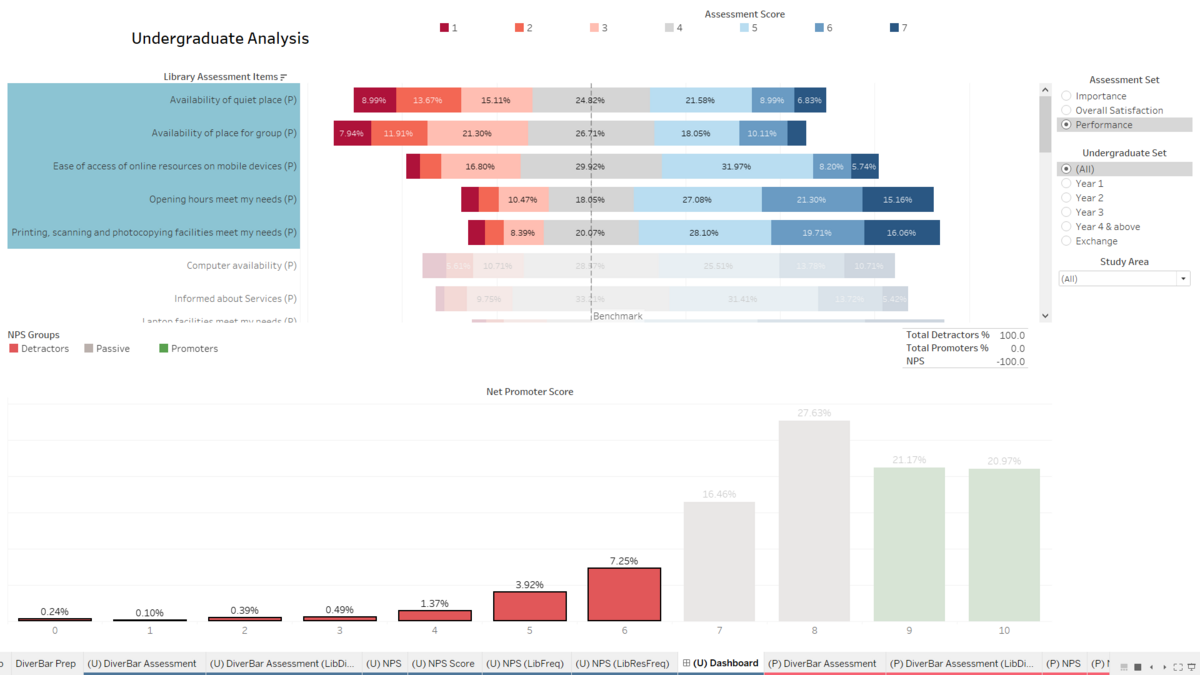
In terms of performance, the top 5 worst performing library elements as seen in the chart above are:
- Availability of place for group
- ~ 22% students indicated unsatisfied
- Availability of quiet place
- ~ 17% students indicated unsatisfied
- Ease of access of online resources on mobile devices
- ~ 13% students indicated unsatisfied
- Computer availability
- ~ 10% students indicated unsatisfied
- Opening hours
- ~ 7% students indicated unsatisfied
Earlier we mentioned that Availability of quiet place and Opening hours being important to all undergraduates and Availability of place for group being important to some undergraduate groups (such as Year 1 students). These elements that are important to students are not performing well. Many students find that the library is lacking in quiet places to study and conduct group work. Some students find that the opening hours could be improved.
Since the SMU libraries generally have long opening hours with exception of Saturdays and Sundays, perhaps improvements could start with those days.
For the most part, the unsatisfactory ratings of every element are close to each other and are assumed to be acceptable. However, the Availability of place for group, availability of quiet place, and Ease of access of online resources on mobile devices are, visually, significantly higher than the rest.
One of the ways to create more space without constructing new rooms or spaces would probably be reducing seat hogging. The mobile user interface for accessing library online resources should also be improved as we have seen earlier, some undergraduate groups such as Law and Social Sciences tend to use these resources.
Net Promoter Score
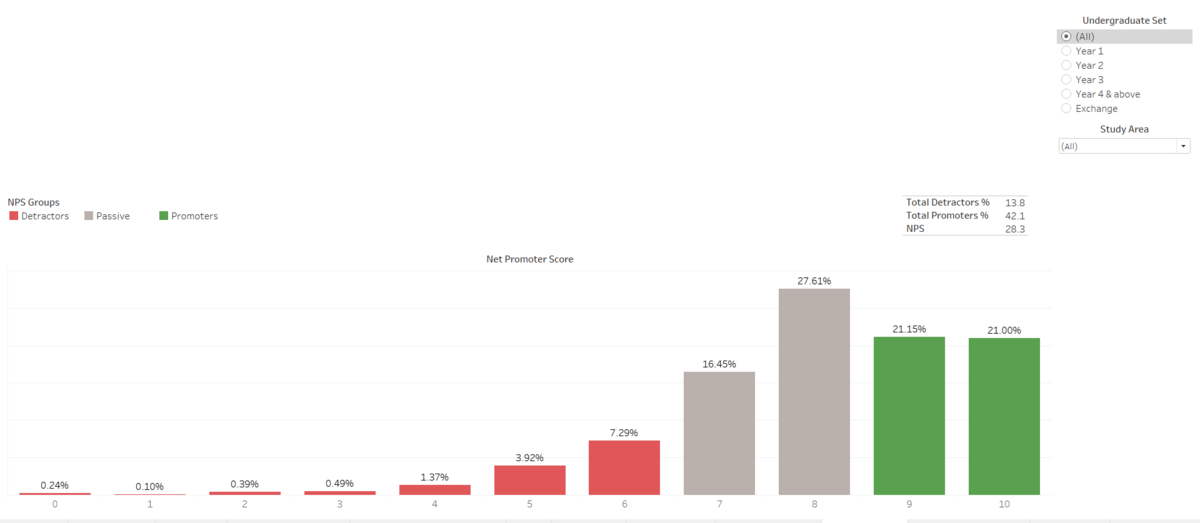
The overall net promoter score, 28.3, is positive for all undergraduate groups as seen in the chart above.
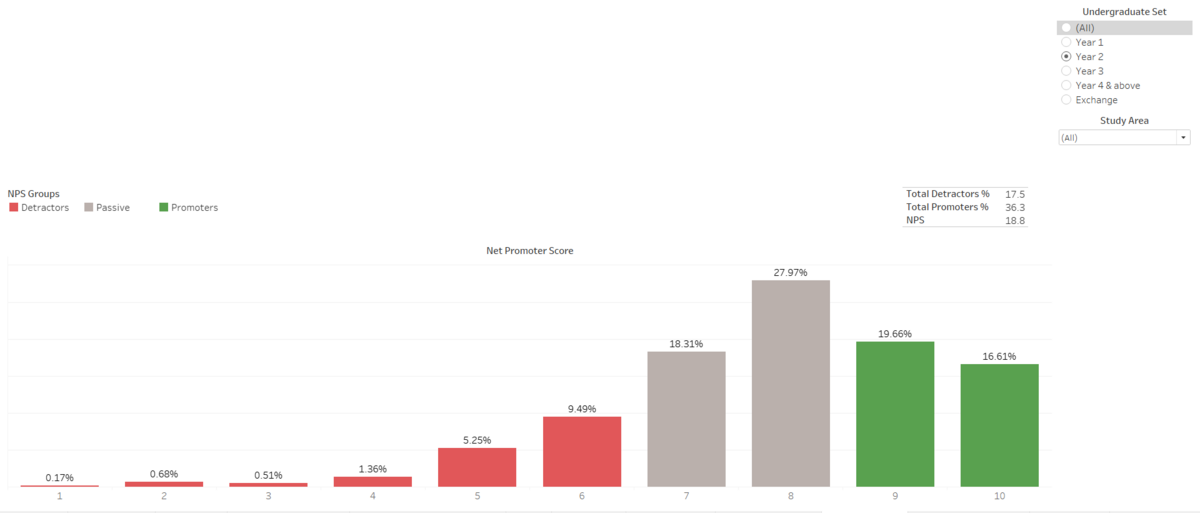
All undergraduate groups have a net promoter score of above 30 with an exception of Year 2 students who have a net promoter score of 18.8 as seen in the chart above.
The top 5 library elements that undergraduate detractors are unsatisfied with, in terms of performance, are similar to the overall top 5 worst performing library elements. As seen in the chart above, they are:
- Availability of quiet place
- ~ 38% detractors indicated unsatisfied
- Availability of place for group
- ~ 41% students indicated unsatisfied
- Ease of access of online resources on mobile devices
- ~ 24% students indicated unsatisfied
- Opening hours
- ~ 18% students indicated unsatisfied
- Printing, scanning and photocopying facilities
- ~ 16% students indicated unsatisfied
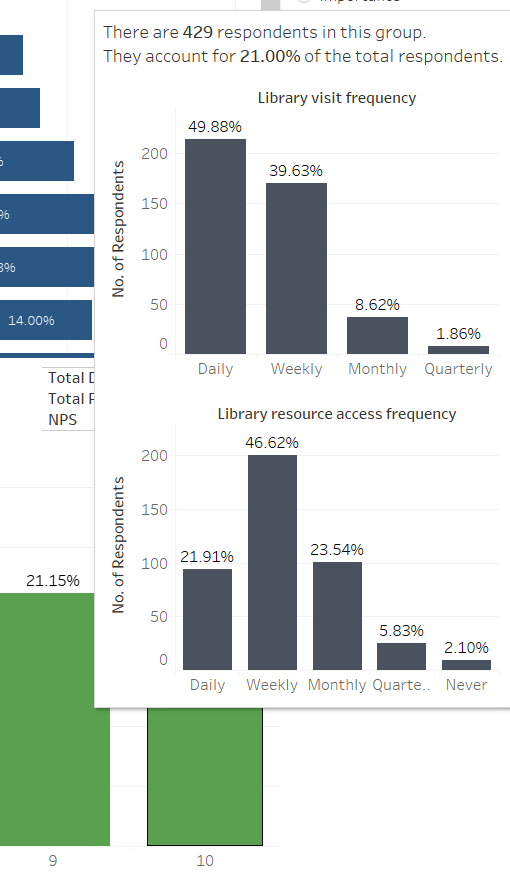
Undergraduates who gave a recommendation score of 10 tend to visit the library Daily than Weekly. The same cannot be said for those who gave a score of 9 and below. Undergraduates who gave a score of 9 and below generally visited the library Weekly than Daily.
Postgraduate Students
Importance
Sorting the chart from the most important to the least important similar to the undergraduates, with more weight given to higher assessment scores for the sorting algorithm, we obtain the top 5 most important library elements as perceived by the postgraduate students (Masters & Doctoral):
- Wireless access availability
- ~ 98% students indicated important
- Opening hours
- ~ 95% students indicated important
- Availability of quiet place
- ~ 96% students indicated important
- Help availability from staff
- ~ 96% students indicated important
- Printing, scanning and photocopying facilities
- ~ 95% students indicated important
The results are similar to what was discovered in the undergraduates’ group with an exception of one element – help availability from staff. Based on the results, postgraduate students tend to value help from staff more than undergraduate students. Furthermore, help from staff is an element uniquely offered by SMU libraries. This could imply that the SMU libraries, as perceived by postgraduate students, have elements that are unique and at the same time, important. Postgraduate students do not view SMU libraries as merely a “study space” as the undergraduates would.
However, the results start to vary across the two postgraduate subgroups. Masters student tend to follow the overall postgraduate trend with an addition of Availability of place for groups. The top 5 most important library elements to Masters students is the same as the top 5 most important library elements to the Year 1 undergraduate students. Perhaps there is more group work that requires face-to-face interaction, as opposed to video conferencing, for Year 1 undergraduate students as well as Masters students.
The results for Doctoral students vary a lot as compared to the overall postgraduate group. The top 5 most important elements to Doctoral students are:
- Wireless access availability
- Usefulness of online resources
- Accessibility of resources and services outside campus
- Efficiency of search engines
- Information resources helpful for University success
Based on the top 5 most important library elements to Doctoral students, we can infer that Doctoral students tend to use the library as a place and as a tool for their research work. It seems like what SMU libraries can uniquely offer is more important to Doctoral students than to Masters students. However, it could also be the case where there are too little data points for Postgraduate students to make such generalization. For the sake of the project, we’ll assume that there are sufficient data points.
Based on the findings, what SMU libraries could do would be to probably prioritize on procuring research materials essential to Doctoral students as opposed to Masters students.
Performance
Sorting the chart from the worst performing library elements to the best performing library elements, the ranking as rated by postgraduate students are as follows:
- Availability of quiet place
- 15% students indicated unsatisfied
- Availability of place for group
- 12% of students indicated unsatisfied
- Opening hours
- 7% of students indicated unsatisfied
- Computer availability
- 10% of students indicated unsatisfied
- Printing, scanning and photocopying facilities
- 8% of students indicated unsatisfied
Postgraduate students’ negative rating on library elements are generally more spread out, meaning, there is no visible cluster of elements that receive significantly more negative assessment scores. For example, for the undergraduate students, the top 3 worst performing elements appear to receive more negative assessment scores than the other elements while it is not the case for the postgraduate students.
As we have discovered earlier that Masters students have similar opinions with undergraduates on what are the important elements to them, we will be focusing on the Doctoral students as they have a vastly different opinion.
The top 5 worst performing library elements are:
- Computer availability
- Usefulness of course specific resources
- Anticipates learning & research needs
- Ease of access of online resources on mobile devices
- Availability of quiet place
The top 4 elements have assessment scores at the negative extreme (Assessment score = 1). It seems like some Doctoral students feel that the SMU libraries are not effective in supplementing their research work. However, what Doctoral students find important are not what they are unsatisfied with based on the earlier importance section and this performance section.
Net Promoter Score
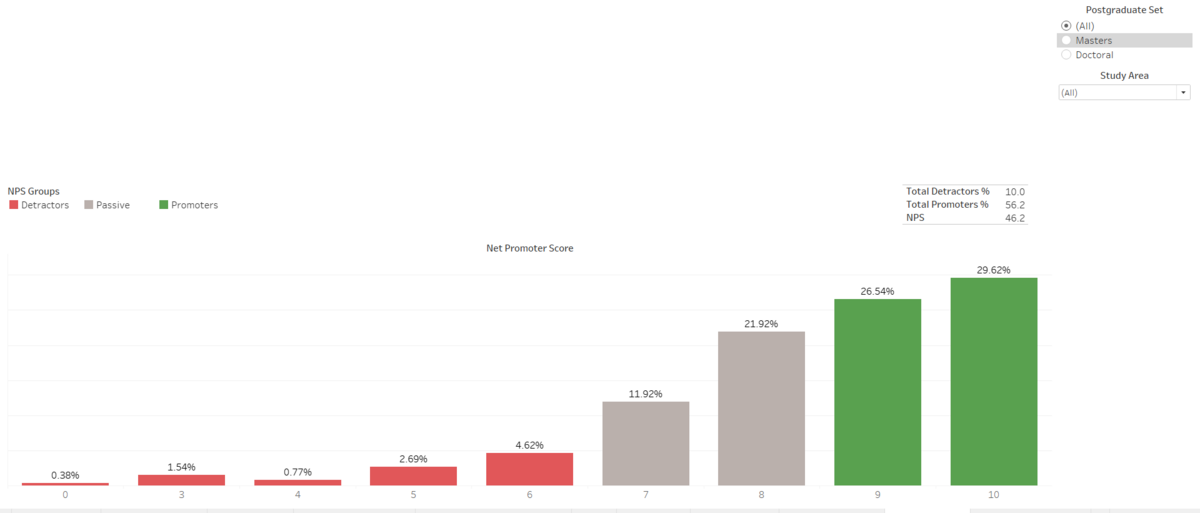
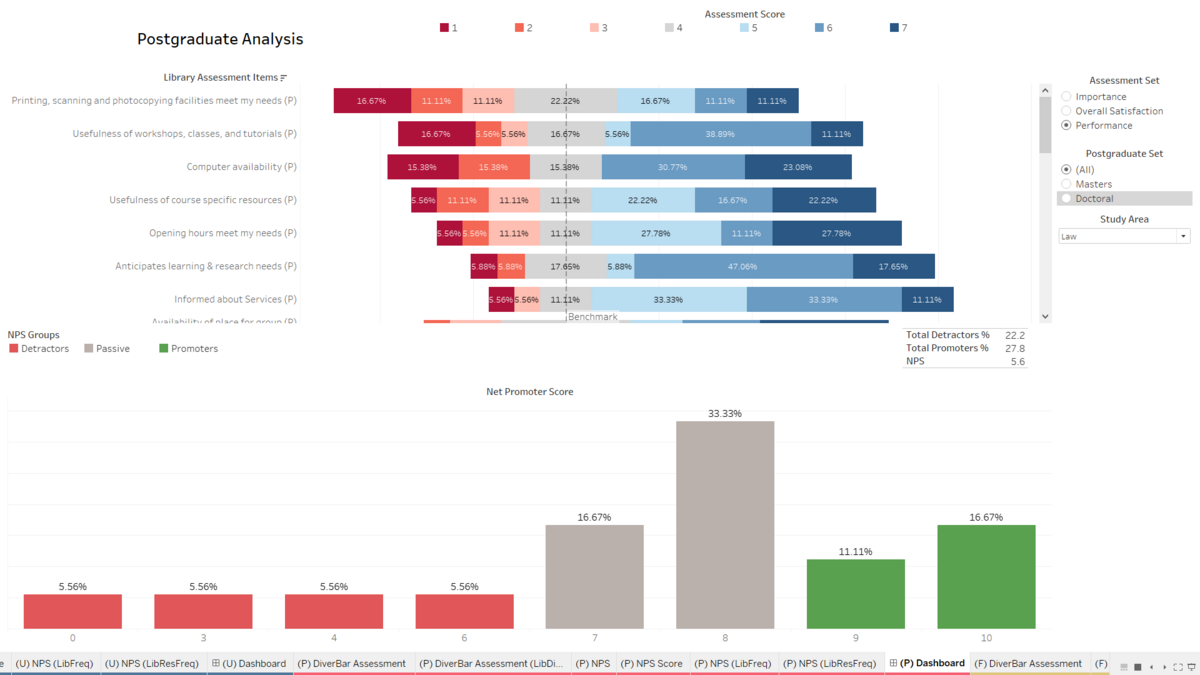
The postgraduate students have a higher NPS score than the undergraduate students. The scores are similar between the two subgroups – Masters and Doctoral.
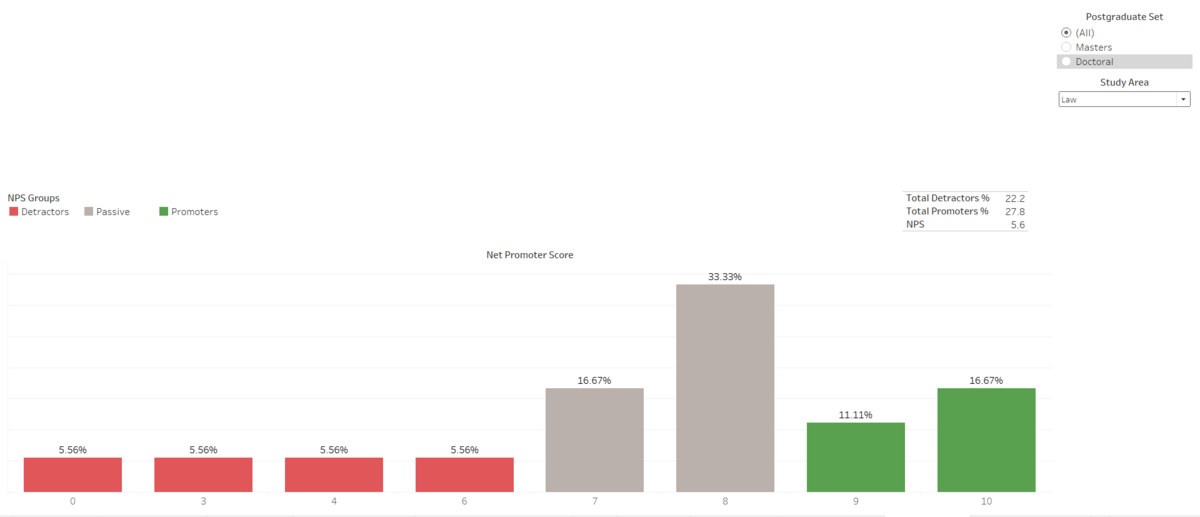
Funnelling into each individual Study Area, I discovered that the net promoter score is way lower for postgraduate students studying law as compared to the other study areas. Again, it could be due to the lack of data but we will take it as it is.
Based on the distribution of the overall charts, we can infer that law postgraduate are indeed more critical about SMU libraries as compared to the overall postgraduate population.
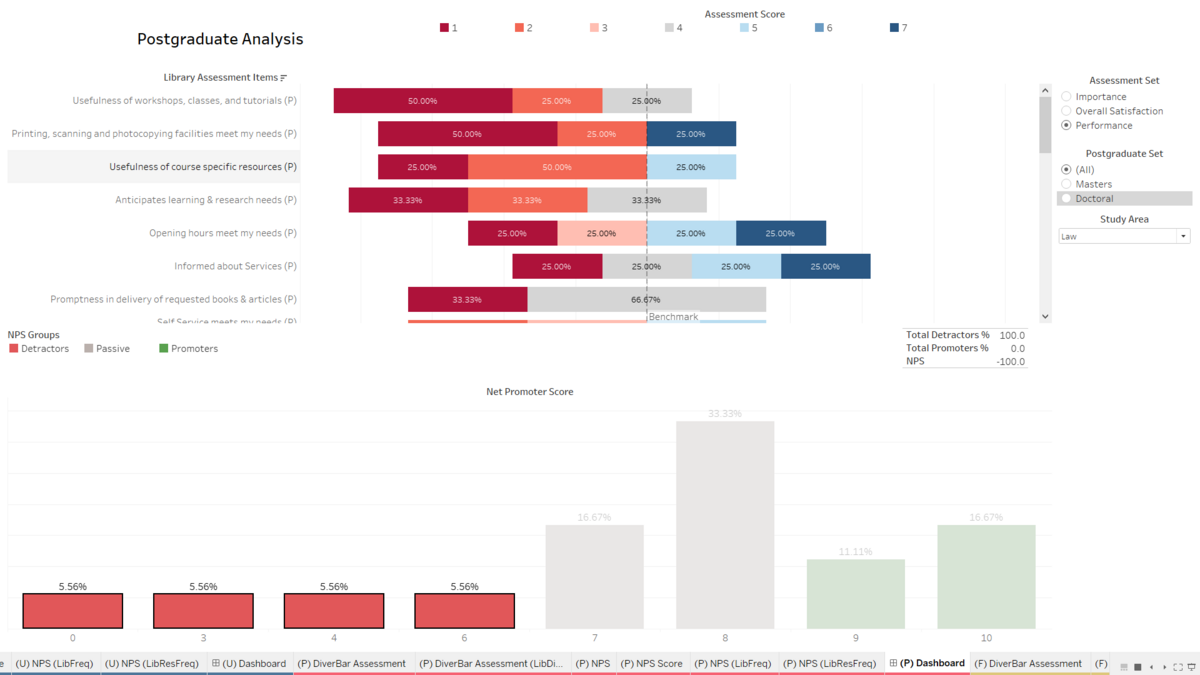
Based on the worst performing library elements rated by the detractors studying law, we come up with the top 5:
- Usefulness of workshops, classes, and tutorials
- Printing, scanning and photocopying facilities
- Usefulness of course specific materials
- Anticipates learning & research needs
- Opening hours
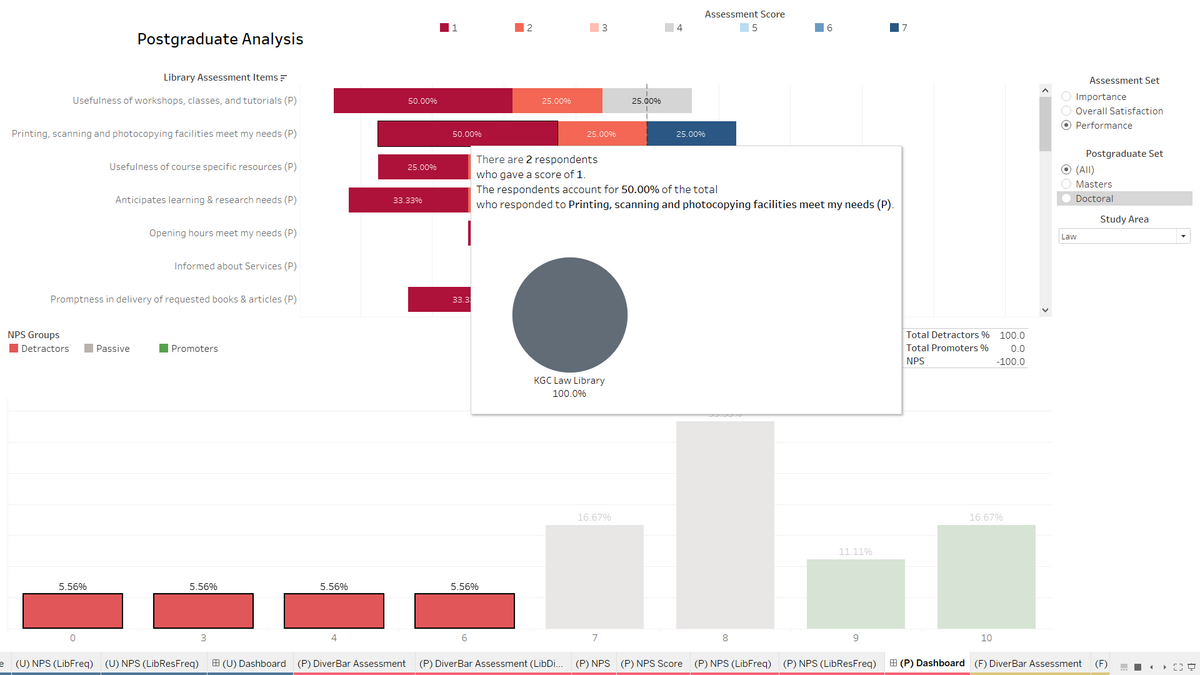
A quick hover around all the negative assessment scores tell me that most of the people who gave these scores tend frequent Kwa Geok Choo Law Library. If the data is sufficient, perhaps Kwa Geok Choo Law Library should work on improving their program offerings (workshops, classes, and tutorials) as well as admin facilities (printing, scanning, and photocopying).
Faculty
Importance
Ranked from most important to least important, we obtain the top 5 library elements most important to the faculty group:
- Help availability from staff
- ~ 98% faculty indicated important
- Accessibility of resources and services outside campus
- ~ 96% faculty indicated important
- Usefulness of online resources
- ~ 98% faculty indicated important
- Efficiency of search engines
- ~ 98% faculty indicated important
- Staff provide accurate answers to enquiries
- ~ 97% faculty indicated important
Based on the ranking list, we can infer that the SMU faculty view SMU libraries as only a means for resources. All the 5 elements are associated with ways to obtain these resources as well as the resources themselves. The trend is vastly different from the previous two groups of students, the undergraduates and postgraduates, with an exception of perhaps the postgraduate subgroup, Doctoral. We can make a preliminary conclusion that Doctoral students and the Faculty have similar opinions on the importance of SMU libraries.
It seems as if the higher the education level, from undergraduate students, to postgraduate students, to professors, the more important are the unique offerings of SMU libraries. At lower education levels, respondents tend to perceive SMU libraries merely as a place to study while at higher education levels, respondents tend to perceive SMU libraries as a platform to obtain valuable information that could help them in their research.
Performance
Ranked from the worst performing to the best performing library elements, we come up with the top 5 worst performing library elements based on the rating by the faculty group:
- Efficiency of search engines
- ~ 6% faculty indicated unsatisfied
- Computer availability
- ~ 12% faculty indicated unsatisfied
- Signage
- ~ 3% faculty indicated unsatisfied
- Usefulness of workshops, classes, and tutorials
- ~ 4% faculty indicated unsatisfied
- Opening hours
- ~ 2% faculty indicated unsatisfied
To reiterate, the sorting is not based on percentage values, but rather, raw count. From the results, we can infer that the faculty group is generally more satisfied with the library than the other major groups – Undergraduates and postgraduates. Only a small percentage of faculty is unsatisfied with certain elements such as Efficiency of search engines and Computer availability.
Besides Efficiency of search engines, none of top 5 worst performing library elements is the same as the top 5 most important library elements. Perhaps if there were more data points to make the findings more conclusive, SMU libraries could focus on making their search engines more efficient as we have seen earlier, law undergraduates and doctoral postgraduates also view this element as important.
Furthermore, the faculty group tends to be more critical when it comes to searching for materials. If there are some faculty members unsatisfied with the efficiency of the search engine, SMU libraries should find out how they can improve the search engines.
Net Promoter Score
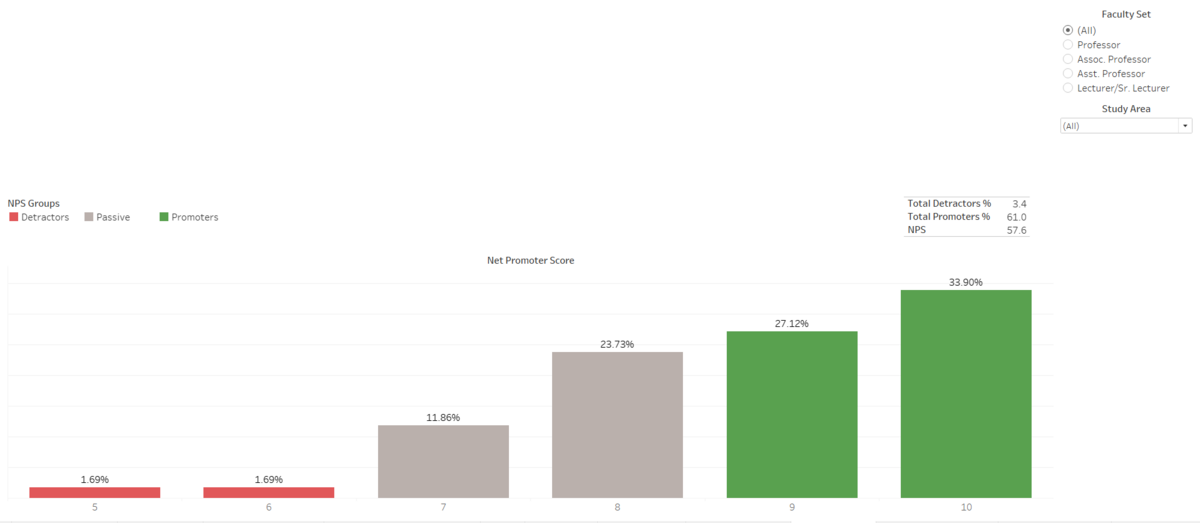
From the chart and information above, we can see that the net promoter score for the faculty group is much higher than the net promoter scores for the other two major groups – Undergraduates and postgraduates. In fact, there are only 3.4% detractors in the faculty group as compared to 13.8% detractors in the undergraduates’ group and 10% detractors in the postgraduates’ group.
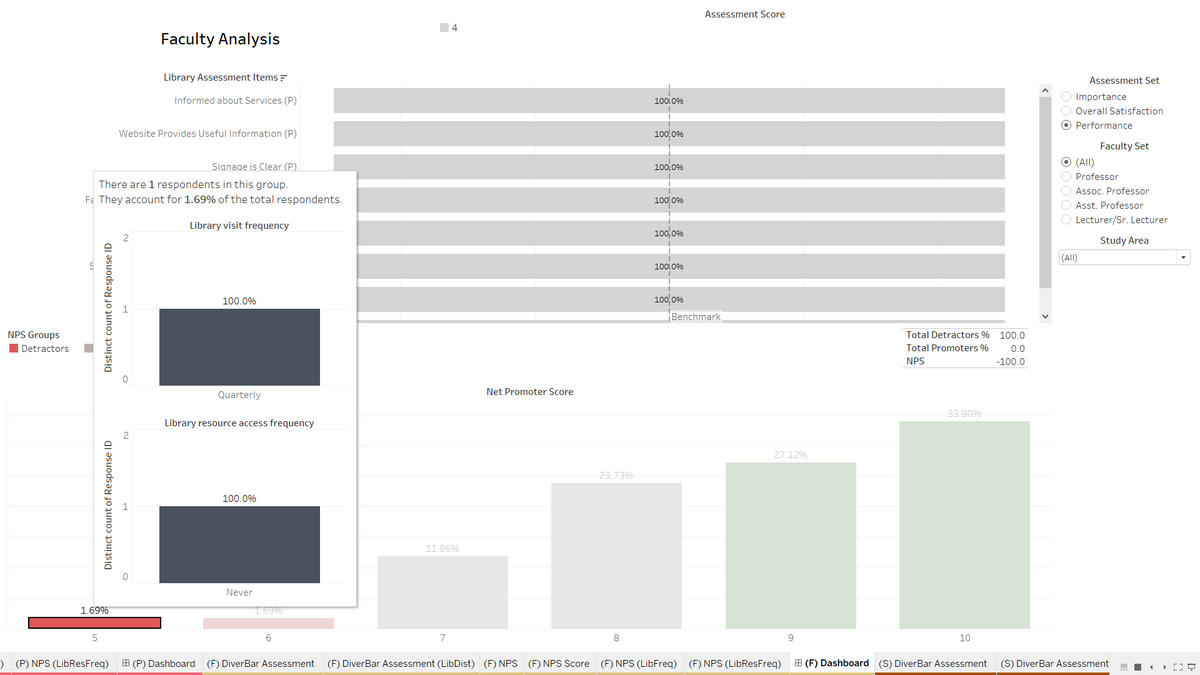
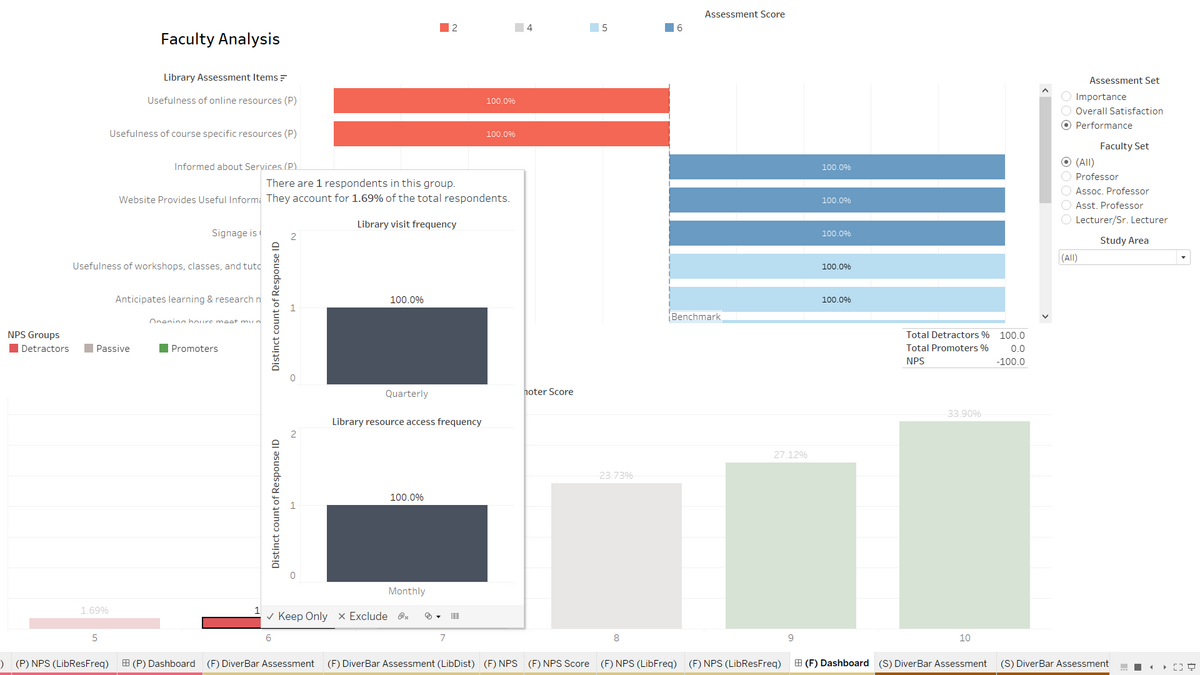
Both detractors who gave a recommendation score of 5 and 6, visited SMU libraries every quarterly. It could mean that low frequency of visit led to them being a detractor or it could also mean that their dissatisfaction with SMU libraries led them to visit infrequently and being a detractor.
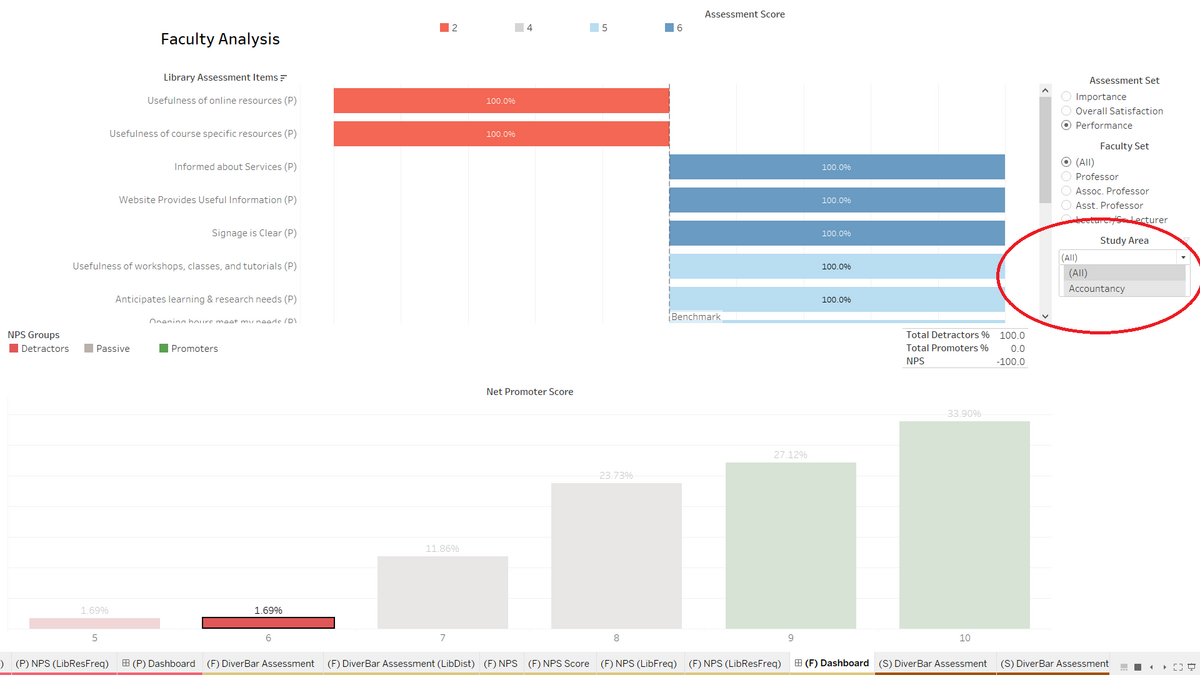
For the detractor who gave a score of 6, the only 2 library elements that were unsatisfactory (which might have resulted in the respondent being a detractor) are Usefulness of online resources and Usefulness of course specific resources.
Circled in red, we can also see that this particular faculty member is most likely from the School of Accountancy or in the Study Area of Accountancy.
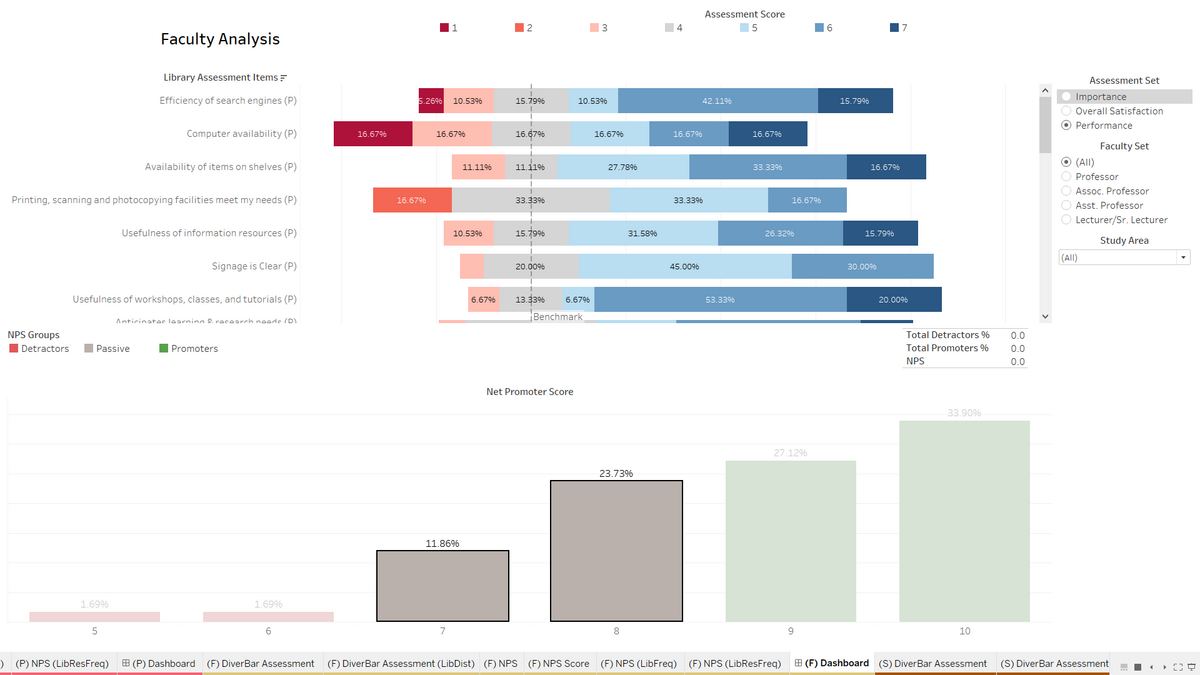
Filtering by the neutral recommenders – faculty members who gave a recommendation score of 7 or 8 – we take a look at the library elements that are unsatisfactory to them. Perhaps by improving these areas, we can convert the neutral recommenders to promoters.
