IS428 AY2019-20T2 Assign ARINO ANG JIA LER
Contents
Overview
Background
Every two years, SMU Libraries conduct a comprehensive survey in which faculty, students and staff have the opportunity to rate various aspects of SMU library's services. The objective of the survey is to provide these libraries with input to help improve existing services as well as information regarding anticipating emerging needs of SMU faculty, students (undergraduates and postgraduates), and staff. The latest survey ended on 17th February 2020. The past reports are mainly made-up of large numbers of pages of tables, which are difficult to comprehend. The difficulty in comprehension has resulted in the inability to draw useful information that could help SMU Libraries in making the necessary improvements or changes.
Objective
The aim of this project is to design a better dashboard/report that would allow SMU Libraries to extract valuable insights from the perspective of undergraduate students, postgraduate students, faculty, and staff. The dashboard designs would mainly surround the responses of each assessment item in the survey (e.g. services provided by the library) as well as the net promoter score. There would also be some focus on the sub-attributes of people who provide certain responses (e.g. attributes of respondents who are unhappy with a certain service provided by the library).
Data preparation
Dataset
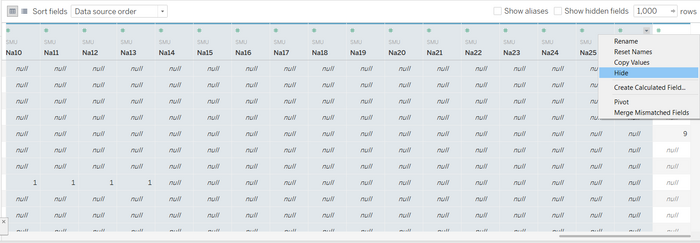
The dataset provided in this project is the 2018 Library Survey dataset. In this dataset, there are 89 variables and 2639 responses. 26 of the 88 variables are not applicable (NA01 – NA26), thus, we are excluding these 26 variables. There is 1 identifier variable used to uniquely identify each response (ResponseID)
For the remaining 62 variables, 26 of them measures the importance of each assessment (i01 – i26), and the other 26, based on the same questions, measures the performance of each assessment (P01 – P26). There is 1 variable on overall satisfaction of the library, measured using performance as well (P27). All assessment variables are based on Likert Scale data.
The remaining 9 variables provides information on respondent behaviour (Campus, HowOftenL, HowOftenC, HowOftenW), characteristics (StudyArea, Position, ID), net promoter score (NPS1) and an open-ended comment section (Comment1).
Data cleaning & transformation
| Screenshots | Description |
|---|---|
|
Figure 1.0: Hiding of columns |
|
|
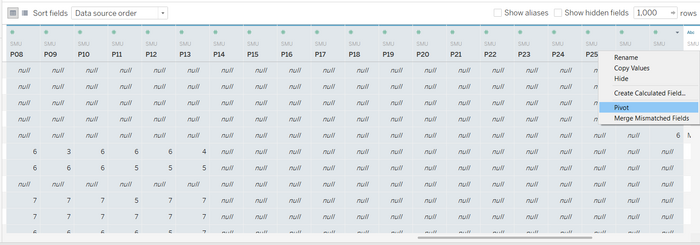
Figure 2.0: Pivoting of Columns |
|
|
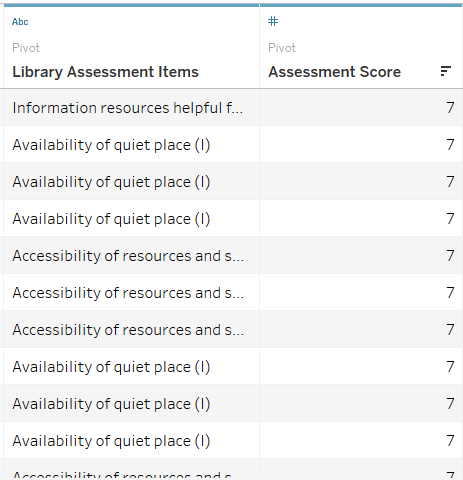
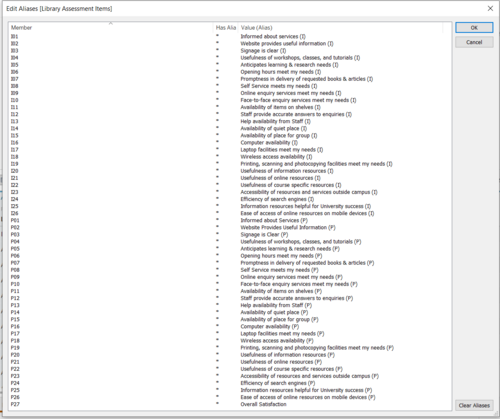
Figure 3.0: Renamed Columns Figure 3.1: Aliases for Assessment Items |
|
|
Image |
|
|
Image |
|
|
Image |
|
|
Image |
|
|
Image |
|
|
Image |
|
|
Image |
|
|
Image |
|
Dashboard
Storyboard Link
Link:
Storyboard Overview
Overall level of service
Overall Satisfaction of Library
Performance ranking of Assessment Items
Importance ranking of Assessment Items
Net Promoter Score
Levels of service perceived by each Group
Undergraduates
Postgraduates
Faculty
Staff
Additional Tooltips
Analysis & Insights
For the following sections, we would explore the data based on each major group of library users. However, there would be some cross referencing and comparison across the major groups. There would also be different levels of analysis for each major group or subgroup depending on what is relevant.


