Group08 proposal
|
Project name |
|
|
|
|
Contents
PROBLEM & MOTIVATION
Problem
As a buyer looking for flats in matured estates, or Resale HDB flats, it can be difficult to make a decision on your dream home due to the lack of information in the market and the tools to make comparisons. This problem is amplified further by buyers' complete lack of knowledge to decide if a price is good compared to the market average.
Motivation
According to Ms. Christine Sun, head of research and consultancy at OrangeTee, demand for HDB resale flats has been strengthening. Our group feels that with the increasing demand for HDB resale flats and the lack of information and tools in this area, there is a strong need for us to address the issue.
Source: https://www.straitstimes.com/singapore/more-hdb-resale-flats-sold-in-october-after-higher-housing-grants-income-ceilings-kicked
DATASET
Candidates:
- https://www.kaggle.com/AnalyzeBoston/crimes-in-boston
- https://data.gov.sg/dataset/resale-flat-prices
- https://www.kaggle.com/sudalairajkumar/novel-corona-virus-2019-dataset
BACKGROUND SURVEY OF RELATED WORK
Background surveyy
Lorem ipsum blah blah
| Reference of Other Interactive Visualization | Learning Points |
|---|---|
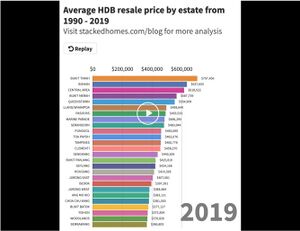
Title: Visualising 30 years of HDB resale flat prices between 1990 - 2019
Source: https://www.reddit.com/r/singapore/comments/dubsyk/visualising_30_years_of_hdb_resale_flat_prices/ |
|
Title: Distribution of 4-Room HDB Resale Prices By Town |
|
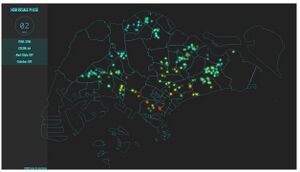
Title: Singapore Property Prices Heatmap Source: https://www.greyloft.com/singapore/property-prices-heatmap |
|
Title: Heat Map of Median Resale Price Source: https://public.tableau.com/profile/darrick8462#!/vizhome/HDBResaleAnalysisDDO/HDBRESALEDASHBOARD |
|
REFERENCE LIST
References
KEY TECHNICAL CHALLENGES & MITIGATION
Technical challenges
STORYBOARD
stooryboard
MILESTONES
milestonesssssssssssss
COMMENTS
| No. | Name | Date | Comments |
|---|---|---|---|
| 1. | (Name) | (Date) | (Comment) |
| 2. | (Name) | (Date) | (Comment) |
| 3. | (Name) | (Date) | (Comment) |

