Difference between revisions of "Analysis & Recommendations"
| Line 8: | Line 8: | ||
! Demographics !! Analysis | ! Demographics !! Analysis | ||
|- | |- | ||
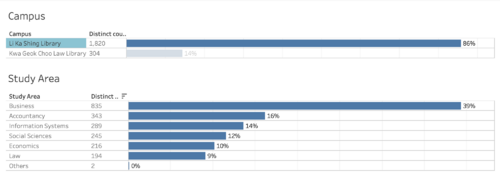
| − | | [[File:Screen Shot 2020-03-21 at 4.57.48 PM.png| | + | | [[File:Screen Shot 2020-03-21 at 4.57.48 PM.png|500px|frameless|center]] || As highlighted, the majority of undergraduate respondents prefer the Li Ka Shing Library (86%) to Kwa Geok Choo Law Library (16%). Furthermore business students filled out the survey much more than other areas of study. It will be important to keep this in mind as we walk through the analysis as the data is skewed in favor of these two groups. |
|} | |} | ||
| Line 25: | Line 25: | ||
! Demographics !! Analysis | ! Demographics !! Analysis | ||
|- | |- | ||
| − | | [[File:Screen Shot 2020-03-21 at 5.18.52 PM.png| | + | | [[File:Screen Shot 2020-03-21 at 5.18.52 PM.png|500px|frameless|center]] |
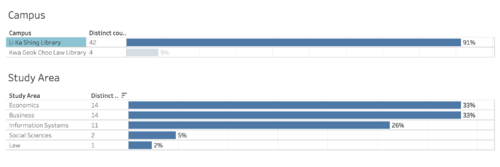
|| As highlighted, the majority of graduate respondents prefer the Li Ka Shing Library (91%) to Kwa Geok Choo Law Library (9%). Furthermore, economics and business students filled out the survey much more than the other areas of study. It will be important to keep this in mind as we walk through the analysis as the data is skewed in favor of these groups. | || As highlighted, the majority of graduate respondents prefer the Li Ka Shing Library (91%) to Kwa Geok Choo Law Library (9%). Furthermore, economics and business students filled out the survey much more than the other areas of study. It will be important to keep this in mind as we walk through the analysis as the data is skewed in favor of these groups. | ||
|} | |} | ||
| Line 32: | Line 32: | ||
[[File:Screen Shot 2020-03-21 at 5.20.50 PM.png|800px|frameless|center]] | [[File:Screen Shot 2020-03-21 at 5.20.50 PM.png|800px|frameless|center]] | ||
| + | |||
| + | Similarly, we see that Graduate students have the top 5 in each category as undergraduate students. Right away this signifies that the requirements and opinions of students are not bounded by their position in school. It is noted that the average score of each response vary a little. For example, the importance factor, “Opening hours meet my needs” ranked on average .2 higher than graduate students. This could be because graduate students often have classes at “off” times, such as on weekends, as compared to undergraduate students. This means that their ability to get into the library when graduate students are already on campus so that they can study may be more difficult. Similarly, you do see that SMU Libraries scored relatively high on this question’s performance. However, it is important to note that while it was high scoring relative to other performance factors, it still scored an average of .6 lower than the importance of that factor. Again, this could indicate that expectations are not being meet for this factor. This is obviously similar for the other top 4 most important factors who did not make it on the top 5 performing list. This indicates that expectations are not being meet for: | ||
| + | - Library staff provide accurate answers to my inquiries (12) | ||
| + | - I can get help from library staff when I need it (13) | ||
| + | - I can get wireless access in the Library when I need to (18) | ||
| + | - Online resources (e.g. online articles, databases, ebooks) are useful for my studies and help me with my learning and research needs (21) | ||
| + | Again, this indicates to SMU Library Services that students’ expectations of their services are not being met, signifying that SMU Library Services are under performing on what is most important to students. It is also important to note that one of the most important factors, “I can find a quiet place in the library to study when I need to” was one of the bottom performing services for graduate students with an average score of 5.4 and the highest percentage of low scores among all of the bottom scores. It can be noted that all of the bottom performing services are still skewed to the higher scores, meaning that relatively SMU Library Services are doing well for Graduate students. | ||
Revision as of 12:34, 22 March 2020
Contents
Analysis & Final Recommendations
To showcase the survey results, an interactive dashboard was created and shared on Tableau Public. The final is attached here.
Undergraduate
Demographics
| Demographics | Analysis |
|---|---|
| As highlighted, the majority of undergraduate respondents prefer the Li Ka Shing Library (86%) to Kwa Geok Choo Law Library (16%). Furthermore business students filled out the survey much more than other areas of study. It will be important to keep this in mind as we walk through the analysis as the data is skewed in favor of these two groups. |
Analysis
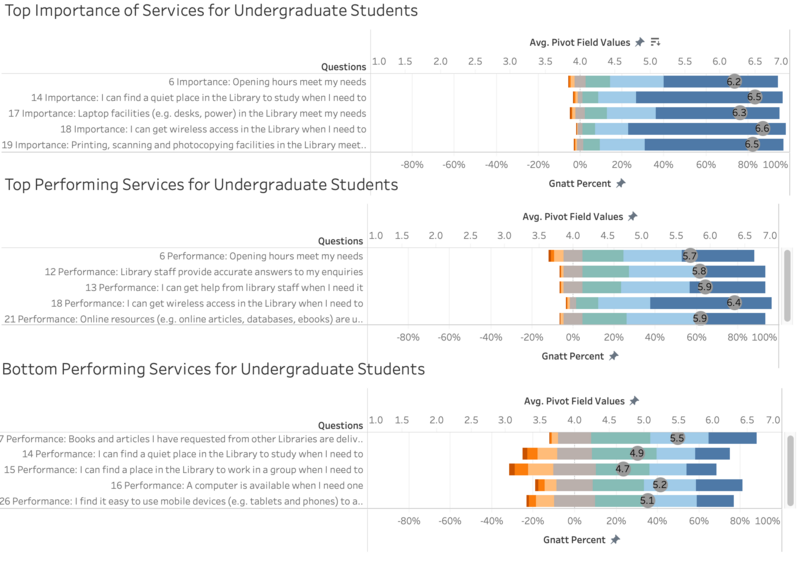
To focus the analysis to highlight which areas SMU Libraries are doing well and areas that could be improved. Highlighted below you can see the matches between the importance factors and how it ranked against the top and bottom 5 responses.
Highlighted you can see the matches between the importance factors and how it ranked against the top and bottom 5 responses. We see that two importance factors: Opening hours meet my needs and I can get wireless access in the library when I need to, both made it on the top five for performance. However, it is shown that the average score on performance is lower than the average score for importance, especially for “opening hours meet my needs” who’s performance score is 0.5 points lower than the importance score. This indicates that while the library is doing an overall good job with that metric, that they could look to do further research with students and faculty to understand why the performance score isn’t quite meeting the importance score and adjust as necessary. Additionally, in this visualization we see that one of the lowest performing services, “I can find a quiet place in the library to study when I need to” is also in the top 5 for most important services for undergraduate students. More importantly, when you look across the entire dashboard at undergraduate, graduate, and faculty members, this is a common poor performer. This indicates to SMU Library Services that they are across the board under performing on this service.
Graduate
Demographics
| Demographics | Analysis |
|---|---|
| As highlighted, the majority of graduate respondents prefer the Li Ka Shing Library (91%) to Kwa Geok Choo Law Library (9%). Furthermore, economics and business students filled out the survey much more than the other areas of study. It will be important to keep this in mind as we walk through the analysis as the data is skewed in favor of these groups. |
Analysis
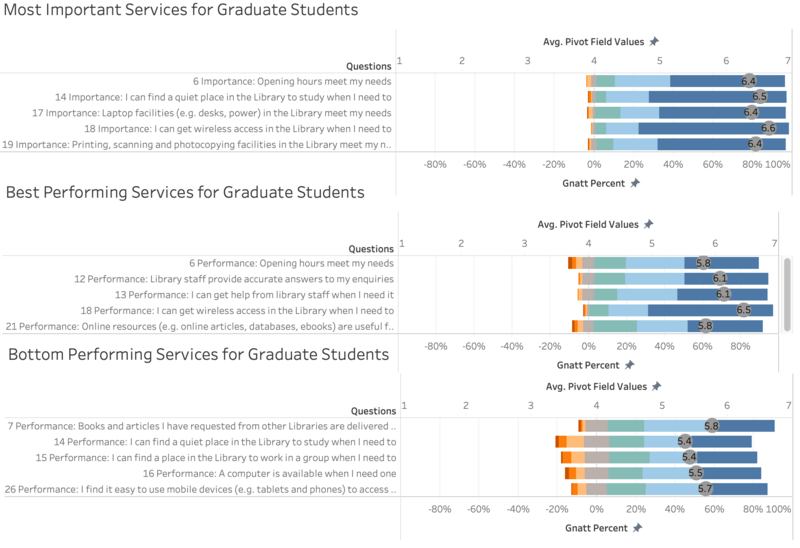
To focus the analysis to highlight which areas SMU Libraries are doing well and areas that could be improved. Highlighted below you can see the matches between the importance factors and how it ranked against the top and bottom 5 responses for Graduate Students.
Similarly, we see that Graduate students have the top 5 in each category as undergraduate students. Right away this signifies that the requirements and opinions of students are not bounded by their position in school. It is noted that the average score of each response vary a little. For example, the importance factor, “Opening hours meet my needs” ranked on average .2 higher than graduate students. This could be because graduate students often have classes at “off” times, such as on weekends, as compared to undergraduate students. This means that their ability to get into the library when graduate students are already on campus so that they can study may be more difficult. Similarly, you do see that SMU Libraries scored relatively high on this question’s performance. However, it is important to note that while it was high scoring relative to other performance factors, it still scored an average of .6 lower than the importance of that factor. Again, this could indicate that expectations are not being meet for this factor. This is obviously similar for the other top 4 most important factors who did not make it on the top 5 performing list. This indicates that expectations are not being meet for: - Library staff provide accurate answers to my inquiries (12) - I can get help from library staff when I need it (13) - I can get wireless access in the Library when I need to (18) - Online resources (e.g. online articles, databases, ebooks) are useful for my studies and help me with my learning and research needs (21) Again, this indicates to SMU Library Services that students’ expectations of their services are not being met, signifying that SMU Library Services are under performing on what is most important to students. It is also important to note that one of the most important factors, “I can find a quiet place in the library to study when I need to” was one of the bottom performing services for graduate students with an average score of 5.4 and the highest percentage of low scores among all of the bottom scores. It can be noted that all of the bottom performing services are still skewed to the higher scores, meaning that relatively SMU Library Services are doing well for Graduate students.


