|
|
| Line 279: |
Line 279: |
| | |} | | |} |
| | | | |
| − | ===Postgraduate===
| |
| | | | |
| − | {| class="wikitable"
| |
| − | |-
| |
| − | ! style="font-weight: bold;background: #3b3b3b;color:#fbfcfd;width: 5%;" | S/N
| |
| − | ! style="font-weight: bold;background: #3b3b3b;color:#fbfcfd;width: 48%;" | screen shotw
| |
| − | ! style="font-weight: bold;background: #3b3b3b;color:#fbfcfd;" | Insights
| |
| − | |-
| |
| − | | <center>'''1'''</center>
| |
| − | ||
| |
| − | [[File:Slide11.jpg|600px|frameless|center]]
| |
| − | ||'''Library Performance vs Importance'''<br>
| |
| − | *249 respondents from postgraduate group. Library performance in all segments are consistent with 29% -41% in highly satisfied, which still lack behind postgraduate overall thoughts of being highly important. The biggest gap belongs to facilities & equipment segment of 18%, while closest is 2% in service delivery segment.
| |
| − |
| |
| − | |-
| |
| − | | <center>'''2'''</center>
| |
| − | ||
| |
| − | [[File:Slide22.jpg|600px|frameless|center]]
| |
| − | ||
| |
| − | *18 postgraduates from accountancy study area has slightly better performance in their highly satisfied compare to highly importance in service delivery segment.
| |
| − | |-
| |
| − |
| |
| − | | <center>'''3'''</center>
| |
| − | ||[[File:Slide13.jpg|600px|frameless|center]]
| |
| − | ||
| |
| − | *Similarly, 135 postgraduates from business study area have slightly better performance in their highly satisfied compare to highly importance in service delivery segment.
| |
| − | |-
| |
| − |
| |
| − | |-
| |
| − | | <center>'''4'''</center>
| |
| − | ||
| |
| − | [[File:Slide14.jpg|600px|frameless|center]]
| |
| − | ||
| |
| − | *Moreover, 43 postgraduates that visit the library on a monthly basis have the best performance in their highly satisfied compare to highly importance in service delivery segment.
| |
| − | |-
| |
| − |
| |
| − | |-
| |
| − | | <center>'''5'''</center>
| |
| − | ||
| |
| − | [[File:Slide15.jpg|600px|frameless|center]]
| |
| − | ||
| |
| − | *Lastly 6 out of 8 postgraduates that never use library resources have the highest highly satisfied compare to highly important in service delivery segment. Hence, the postgraduates from this and previous 3 filters contribute to a significant success to the questions answered in service delivery.
| |
| − | |-
| |
| − |
| |
| − | |-
| |
| − | | <center>'''6'''</center>
| |
| − | ||
| |
| − | [[File:Slide16.jpg|600px|frameless|center]]
| |
| − | ||'''Survey Qns Performance'''<br>
| |
| − | *In information resource segments, ‘Quiet place availability’ and ‘group work area availability’ have 37, 29 respondents respectively that are dissatisfied on the library performances in these areas, contributing to 10-16% of the total postgraduates’ opinions. Staff helpfulness and reliability in facilities & equipment segment and wireless access availability and laptop facilities in information resource segment had more than 100 respondents rated for highly satisfied. In general, the rest of the components were at a consistent level of between 50 – 100 highly satisfied and 5 – 16 dissatisfied votes from postgraduate.
| |
| − |
| |
| − | |-
| |
| − |
| |
| − | |-
| |
| − | | <center>'''7'''</center>
| |
| − | ||
| |
| − | [[File:Slide17.jpg|600px|frameless|center]]
| |
| − | ||
| |
| − | *16 out of 23 postgraduate that taken the survey were from KGC Law library. Thus, 7 out of 16 law postgraduates have rated dissatisfaction with the ‘printing, scanning, photocopying facilities’ of KGC Law Library. This see a need for improvement in the facilities as 30% of the postgraduate utilising KGC Law library have express dissatisfaction in it.
| |
| − | |-
| |
| − |
| |
| − | |-
| |
| − | | <center>'''8'''</center>
| |
| − | ||
| |
| − | [[File:Slide18.jpg|600px|frameless|center]]
| |
| − | ||
| |
| − | *53 Postgraduate from information system study area, see the least dissatisfaction in all segments, especially in communication and service delivery segments. Moreover, the highest dissatisfaction was ‘Computer availability’ from information resource segment. Hence, SMU library can reserve or install more computers specifically for the postgraduate from information system.
| |
| − | |-
| |
| − |
| |
| − | |-
| |
| − | | <center>'''9'''</center>
| |
| − | ||
| |
| − | [[File:Slide19.jpg|600px|frameless|center]]
| |
| − | ||'''Satisfaction'''<Br>
| |
| − | *In general, the postgraduates were satisfied with SMU library, with very satisfied taking majority of postgraduate opinions. Moreover, there were no dissatisfaction in postgraduate from accountancy, economics, information systems, social sciences, which contribute to about 40% of the total respondents. In fact, respondents that were dissatisfied with SMU library only contribute to 4 records.
| |
| − | |-
| |
| − |
| |
| − | |-
| |
| − | | <center>'''10'''</center>
| |
| − | ||
| |
| − | [[File:Slide20.jpg|600px|frameless|center]]
| |
| − | ||'''Advocacy'''<br>
| |
| − | *The net promoter scores show that the library is doing quite well for the postgraduates with score between 44 – 57 except for respondents from law study area with a score of 6. Hence, there room for improve is still needed for postgraduate from law that visit GCK law library with 18 records. Furthermore, social sciences have no respondents from detractor but that only contribute from 2 records.
| |
| − | |-
| |
| − | |}
| |
| − |
| |
| − | ===Faculty===
| |
| − |
| |
| − | {| class="wikitable"
| |
| − | |-
| |
| − | ! style="font-weight: bold;background: #3b3b3b;color:#fbfcfd;width: 5%;" | S/N
| |
| − | ! style="font-weight: bold;background: #3b3b3b;color:#fbfcfd;width: 48%;" | screen shot
| |
| − | ! style="font-weight: bold;background: #3b3b3b;color:#fbfcfd;" | Insight and Significance
| |
| − |
| |
| − | |-
| |
| − | | <center>'''1'''</center>
| |
| − | ||
| |
| − | [[File:Slide31.jpg|600px|frameless|center]]
| |
| − | ||'''Library Performance vs Importance'''<br>
| |
| − | *57 respondents from faculty. Faculty were satisfied with library performance with majority in highly satisfied ratings of 30-50% in all the segments. Also, 8-13% neutral, 13 – 20% satisfied, 27 – 40% very satisfied and 2-5% in dissatisfied. Comparing with importance, SMU library has done well serving faculty in facilities & equipment and service delivery with 18% and 10% gap respectively between highly satisfied and highly important.
| |
| − | |-
| |
| − |
| |
| − | | <center>'''2'''</center>
| |
| − | ||
| |
| − | [[File:Slide42.jpg|600px|frameless|center]]
| |
| − | ||
| |
| − | *Faculty from business shows the only lowest highly satisfied ratings as compare to highly important ratings. Hence, only this section was not aligned with the rest of the faculty members, thus having bigger portion of dissatisfied and neutral ratings.
| |
| − | |-
| |
| − |
| |
| − | | <center>'''3'''</center>
| |
| − | ||
| |
| − | [[File:Slide33.jpg|600px|frameless|center]]
| |
| − | ||
| |
| − | *5 faculty from law that visit KGC Law Library had given a 100% highly satisfied ratings but no input were given to its important ratings. Hence, detailing that facilities & equipment segment might not be a important concern for the 5 faculty from law, thus insignificant of having 100% highly satisfied ratings.
| |
| − | |-
| |
| − |
| |
| − | | <center>'''4'''</center>
| |
| − | ||
| |
| − | [[File:Slide44.jpg|600px|frameless|center]]
| |
| − | ||
| |
| − | *23 Faculty that visits the library in a quarterly basis have rated 35% ratings for facilities & equipment. However, only as little as 8% agree as highly important. Hence, detailing that facilities & equipment segment might not be a important concern for the 23 faculty, thus insignificant of having a high highly satisfied ratings.
| |
| − | |-
| |
| − |
| |
| − | | <center>'''5'''</center>
| |
| − | ||[[File:Slide45.jpg|600px|frameless|center]]
| |
| − | ||
| |
| − | *9 faculty that visit the library on a weekly basis have more align on highly satisfied ratings and important. Hence, this category of faculty were the one that’s is of valuable.
| |
| − | |-
| |
| − |
| |
| − | | <center>'''6'''</center>
| |
| − | ||[[File:Slide36.jpg|600px|frameless|center]]
| |
| − | || <center>'''Survey Qns Performance'''<center>
| |
| − | *Dissatisfaction were indicated mostly in ‘clear signage in library’ – communication, ‘item availability’ – facilities & equipment, ‘ quiet place availability’ , ‘group work area availability’, ‘computer availability’ –information resource, ‘search engine enable respondent to find resource fast’ – service delivery of the segments. The outperforming areas were ‘respondent informed about library services’ – communication, ‘wireless access availability’ – information resource, ‘staff helpfulness’, ‘staff reliability’ – facilities & equipment and ‘resources & service reachability outside campus’ – service delivery of the segments.
| |
| − | |-
| |
| − |
| |
| − | | <center>'''7'''</center>
| |
| − | ||[[File:Slide37.jpg|600px|frameless|center]]
| |
| − | ||'''Satisfaction'''<br>
| |
| − | *There were no dissatisfaction indicated by the faculty. Most were in very satisfied ratings except for faculty in business and social sciences with 50% and 43 % highly satisfied ratings. There is a outlier in business faculty where a neutral portion of 12% can be seen. Lastly, law faculty have all voted for very satisfied ratings.
| |
| − | |-
| |
| − |
| |
| − | | <center>'''8'''</center>
| |
| − | ||
| |
| − | [[File:Slide38.jpg|600px|frameless|center]]
| |
| − | ||'''Advocacy'''
| |
| − | *The faculty from information systems have a NPS score of 100, a rare sight in the entire groups of the survey. Hence, faculty from information systems and social sciences are the best advocates for SMU library with 100 and 71 NPS respectively. Meanwhile faculty from the rest of the study areas are in good advocates scoring with accountancy being the lowest and furthest score of 36 from the rest.
| |
| − |
| |
| − | |-
| |
| − |
| |
| − | |}
| |
| − |
| |
| − | ===Staff===
| |
| − |
| |
| − | {| class="wikitable"
| |
| − | |-
| |
| − | ! style="font-weight: bold;background: #3b3b3b;color:#fbfcfd;width: 5%;" | S/N
| |
| − | ! style="font-weight: bold;background: #3b3b3b;color:#fbfcfd;width: 48%;" | screen shot
| |
| − | ! style="font-weight: bold;background: #3b3b3b;color:#fbfcfd;" | Insight and Significance
| |
| − | |-
| |
| − | | <center>'''1'''</center>
| |
| − | ||
| |
| − | [[File:Slide21.jpg|600px|frameless|center]]
| |
| − | ||'''Library Performance vs importance'''
| |
| − | *65 respondents from staff. SMU library perform fairly well for all areas with 7%-14% neutral, 25-35% satisfied, 29% - 36% very satisfied, and 19% - 24% highly satisfied. Dissatisfaction contribute to about 5-8% of each areas in the divergent chart. The gap between highly satisfied and highly important have highest of 6% in information resource area. Whereas, it was the same for communication area, and highly satisfied in facilities & equipment and service delivery areas had exceeded highly important by 2-5%. Therefore, SMU library should maintain its service level in the areas and seek improvement in information resource area for the staff.
| |
| − |
| |
| − | |-
| |
| − | | <center>'''2'''</center>
| |
| − | ||
| |
| − | [[File:Slide32.jpg|600px|frameless|center]]
| |
| − | ||
| |
| − | *15 staffs from business study area that uses library resources in a monthly or weekly basis contributed to the most in disparity between highly satisfied and highly important. Monthly and weekly basis can consider quite frequent. Therefore library could improve their resources in information resource that are used by business staffs frequently.
| |
| − | |-
| |
| − |
| |
| − | | <center>'''3'''</center>
| |
| − | ||
| |
| − | [[File:Slide23.jpg|600px|frameless|center]]
| |
| − | ||'''Survey Qns Performance'''
| |
| − | *Information resource –’computer availability’, service delivery – ‘library search engine enable respondent to find resources quick’ , facilities & equipment – ‘opening hours and anticipation of respondent learning & research needs’ have the highest dissatisfaction in their segments respectively. For communication segments, the dissatisfaction were equally distributed of 3 respondents in dissatisfaction. Also, more than 30% of the staffs were highly satisfied in ‘opening hours’, F2F enquiry service’ in facilities & equipment segment and ‘wireless access availability in information resource segment. The rest of the questions have a consistent of 7 – 15 highly satisfied voted.
| |
| − | |-
| |
| − |
| |
| − | |-
| |
| − | | <center>'''4'''</center>
| |
| − | ||
| |
| − | [[File:Slide34.jpg|600px|frameless|center]]
| |
| − | ||
| |
| − | *Out of 5 Staffs in accountancy study area, only 1 respondents indicated dissatisfaction from ‘online enquiry services’ in facilities & equipment segment.
| |
| − | |-
| |
| − |
| |
| − | |-
| |
| − | | <center>'''5'''</center>
| |
| − | ||
| |
| − | [[File:Slide25.jpg|600px|frameless|center]]
| |
| − | ||
| |
| − | *Staffs with the most records of 26 in information systems has generally low dissatisfaction, especially in facilities & equipment.
| |
| − |
| |
| − | |-
| |
| − |
| |
| − | |-
| |
| − | | <center>'''6'''</center>
| |
| − | ||
| |
| − | [[File:Slide26.jpg|600px|frameless|center]]
| |
| − | ||
| |
| − | *Staffs in social sciences shows that there were no dissatisfaction from facilities & equipment and information resources segments.
| |
| − | |-
| |
| − |
| |
| − | |-
| |
| − | | <center>'''7'''</center>
| |
| − | ||
| |
| − | [[File:Slide27.jpg|600px|frameless|center]]
| |
| − | ||
| |
| − | *Meanwhile, we can see that staffs in business which has the second highest record in staff survey, contributed the most dissatisfaction indicated in facilities & equipment and information resource. Therefore, SMU library can look into how to enhance service level for staffs in business.
| |
| − | |-
| |
| − |
| |
| − | |-
| |
| − | | <center>'''8'''</center>
| |
| − | ||
| |
| − | [[File:Slide28.jpg|600px|frameless|center]]
| |
| − | ||'''Satisfaction'''
| |
| − | *Staffs in accountancy and law study areas only had satisfaction ratings but no highly satisfied were indicated. Moreover, there were no dissatisfied and neutral ratings.Similarly, staffs in economics study area have only very satisfied rating with one of the staff giving neutral rating.
| |
| − | Staffs in information systems and business study areas contain the highest number of respondents with information systems area having majority satisfied rating of 50% and business area having majority very satisfied rating of 68%. Lastly, staffs in social sciences is the one with the highest highly satisfied rating. Hence, SMU library had done exceptionally well in term of service level for staffs in social sciences.
| |
| − | In conclusion, SMU library had done well in terms of staffs satisfaction but could still do better as the percentage of highly satisfied were very low.
| |
| − | |-
| |
| − |
| |
| − | |-
| |
| − | | <center>'''9'''</center>
| |
| − | ||
| |
| − | [[File:Slide29.jpg|600px|frameless|center]]
| |
| − | ||'''Advocacy'''
| |
| − | *Staffs in social sciences study area is the top advocate for SMU library with NPS of 67. Whereas staffs in business, accountancy and information systems study areas can do better. A little concern will be staffs in economics and law study areas as they have NPS of 0. However the records for staffs were very low with 4 from economics and 2 from law compare to business and information systems with 19 and 26 records. Hence, this may not be a constructive feedback of advocacy, as 4 and 2 record is hard to represent the corhort of staffs in economics and law.
| |
| − | |-
| |
| − |
| |
| − |
| |
| − | |-
| |
| − |
| |
| − | |}
| |
| | | | |
| | ==Reference== | | ==Reference== |
SMU Library Survey
Background
Every two years, SMU Libraries conduct a comprehensive survey in which faculty, students and staff have the opportunity to rate various aspects of SMU library's services. The survey provides SMU libraries with input to help enhance existing services and to anticipate emerging needs of SMU faculty, students and staff.
Objectives
With the feedback obtain from the survey, I am tasked to utilize visual analytics approach to reveal the level of services provided by SMU libraries as perceived by:
- the undergraduate students,
- the postgraduate students,
- the faculty,
- the staff.
Summarising Data Set & Planning for Visualisation
The Dataset being used in this visualisation is from SMU Library: 2018 Survey Results. Can be found here
| Dashboard
|
Purpose
|
Variable Require
|
Measurement
|
| Overview
|
This will be the home dashboard of the visualisation which summarise the entire processed data. It is interactive as viewer able to toggle filtering simply by selecting the field. This include:
- Total number of respondents and the background of the respondents
- Total respondents reponding to Li Ka Shing and Kwa Geok Choo Law Libraries respectively
- Total respondents from different position such as Undergraduate/ Graduate / Staff/ Faculty
- Total respondents from different study area such as Accountancy/ Business/ Economics
|
StudyArea, ResponseID, Position
|
Number of respondents
|
| Importance VS Performance
|
This dashboard will provide an overview of respondents' response to libraries service. Rating their importancy and performance for different aspect. Presenting 1 being the lowest to 7 the highest. This will be a interactive interface where viewer able to toggle filtering to narrow down the details such as filtering through which library, which study area and their group position
|
Assessment Item, Score, HowOftenL, HowOftenW
|
Distribution of score rating 1 - 7, Number of respondents
|
| Summary
|
This dashboard will provide an summary of the analysed data where viewer able to compare satisfactory between study area to on the general scale. This could acts as a medium for library to target specific study area to cater to their needs. It also allow viewer to see respondents relationship towards recommending to others based on their overall satisfactory
|
StudyArea, Number of Records, likelihood of recommend the library service to others
|
- Satisfactory difference between study area
- Correlation between people who are satisfied and people who likely to recommend to others
|
Hand-drawn visualisation
Overview
Chart1:
Chart2:
Importance vs Performance
For performance and important (chart 3&4):
Summary
Chart 5:
Chart 6:
Data preparation
| Screenshot
|
Steps Taken
|
|
|
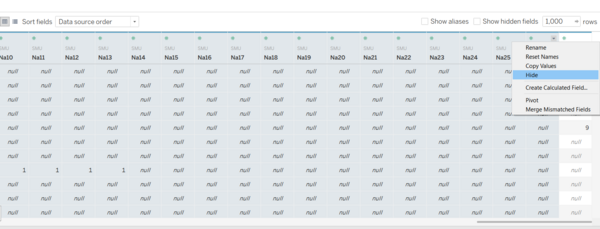
Data Preparation: Hiding
- Hide column NA1-NA26 and comment by right clicking and select hide
|
|
|
Data Preparation: Pivot
- Select column from I01-P27
- Right click and select pivot
|
|
|
Data Preparation: Renaming
Rename the column heading:
- 'Pivot Field Names' to 'Assessment Item'
- 'Pivot Field Values' to 'Score'
- 'How Often L' to 'Visit Library Frequency'
- 'How Often C' to 'Visit Campus Frequency'
- 'How Often W' to 'Resources Used Frequency'
- 'Nps1' to 'likelihood of recommend the library service'
|
|
|
Edit Alias for fields
- Right click the attribute
- Select Aliases
- Change the value(Alias)
- Change for Position, Study Area,Campus, Frequency
|
|
|
New calculated field and set
- Gannt percent, Gannt start, count negative, total count negative, percentage, total count for creating divergent chart in Important Vs Performance Dashboard.
- Kwa Geok Choo Law Library & Li Ka Shing Library for creating pyramid chart in Overview Dashboard.
- Performance Score and Important Score were use for Important Vs Performance Dashboard to show the meaning of the legend
- PositionGroup were use to group position together for filtering and for Overview Dashboard.
|
Interactive Visualization
The interactive visualization can be accessed
here:https://public.tableau.com/profile/neo.tee.yong#!/vizhome/assignment3_15842852167560/LibrarySurvery2018
Overview Dashboard
Overview dashboard.This dashboard depicts a pyramid chart with Kwa Geok Choo Law and Li Ka Shing Libraries. It indicates the no. of respondents with interactivities from group, library visit, use of resources, campus visit and student. Overview page allow user to examine the no. of respondents from KGC Law and LKS libraries with the mentioned interactivities.
Library Performance vs Importance
Library Performance vs Importance dashboard. This dashboard shows a divergent chart (Library Performance) as the main visualisation of how well the library performed in 4 of the segments – Communication, Facilities & Equipment, Information Resources and Service Delivery. The score ratings were replaced into 1 - Highly Dissatisfied, 2 – Very Dissatisfied, 3- Dissatisfied, 4 – Neutral, 5 – Satisfied, 6 – Very Satisfied, 7 – Highly Satisfied. Then an indication (Importance) shows percentage of respondents’ thoughts about the importance of the segments, by 5 – important, 6 – very important, 7 –highly important, matching the colour schemes of percentage responds in satisfied, very satisfied and highly satisfied. Lastly, another indication (records) defined the no. of respondents who answered the questions in each of the segments. In conclusions, group, study area, library, library visit, use of resources filtering will be use in all dashboards as main indicators to identify patterns and anomalies. The creativity of this dashboard allows user to compare library performance in the segments against respondents’ thoughts of how important each of the segments is.
Survey Qns Performance
Survey Qns Performance dashboard. This dashboard shows 4 pyramid charts of each library performance segments – communication, facilities & equipment, information resources and service delivery. Moreover, it consists of all questions asked and responds. The responds are categorised into highly satisfied against dissatisfied & more (dissatisfied, very dissatisfied and highly dissatisfied). This dashboard aid user to identify specific areas to improve and maintain based on the 4 broader segments. Only highly satisfied score was measure and compare as that is what every business, in this case the library’s goal. Vice versa, to convert dissatisfaction segment to satisfaction.
Satisfaction
Satisfaction dashboard. This dashboard shows a divergent chart of respondents’ overall satisfaction by study areas with their respective records.
Advocacy
Advocacy dashboard.This dashboard presents a divergent chart of respondents’ library advocacy by study areas with their respective net promoter scores and records.
Definition for NPS:
If Is negative – higher no. of dissatisfied respondents than satisfied respondents.
0 – 30, there is room for improvement.
30-70, doing great.
Above 70, library advocates.
Findings
Undergraduate
| S/N
|
screen shot
|
Insight and Significance
|
| 1
|
|
Library Performance vs Importance
- 2,027 respondents from the undergraduate.In general, more than 75% of the undergraduate are satisfied and more than satisfied in library performance of the 4 segments – communication, facilities & equipment, information resources and service delivery. Out of the 3 satisfied ratings, very satisfied have the most respondents except for facilities & equipment.
- Comparing with importance:
1.Communication and service delivery are the more consistent segments between their performance and importance. For example, communication performance satisfied metrics were 29%, 30%, 20% while the importance were 25%, 29%, 25%. Whereas, service delivery segment is moderate.
2.However, facilities & equipment segment contribute to bigger gap such as more than 25% difference between their performance and importance in their highly satisfied ratings. Moreover, this segment shows more respondents that are dissatisfied in overall.
|
| 2
|
|
- 328 undergraduates from accountancy show a 2% higher highly satisfied as compare to highly important in service delivery segment, differentiating this category of undergraduate from the rest.
|
| 3
|
|
- 22 law undergraduate that visit library and uses the resources daily has 7% highly satisfied performance than highly importance in the communication segment. Communication segment had performed fairly well in this set of filter.
|
| 4
|
|
- 229 Undergraduate that visit the library monthly has 3% highly satisfied performance than highly importance in the service delivery segment. Therefore, from previous insight, SMU Library could conduct a more detail interview with undergraduate from accountancy that visit the library monthly about the strength of delivery service quality and make improvement.
|
| 5
|
|
Survey Qns performance
Communication
1.Student is informed about library services has the poorest performance in communication platform with 157 dissatisfied, more than dissatisfied and 281 highly satisfied votes.
Facilities & Equipment
1.Library opening hours has the most dissatisfied & more and highly satisfied proportion of ratings.
2.Staff helpfulness, reliability, F2F service and self service are doing well in their performances, with less 50 dissatisfied & more and more than 500 highly satisfied ratings respectively.
3.Item availability, online enquiry services and delivered of books & article promptly are doing moderately well with 80, 52, 54 dissatisfied and more, 393 338, 309 highly satisfied ratings respectively.
4.Anticipation of student learning & research needs and workshops, classes and tutorial meet student research and learning need have the poorest performance in facilities & equipment segment with 111,117 dissatisfied and more, 316 and 286 highly satisfied ratings respectively.
Information Resources
1.Wireless accessibility performed the best in information resources. Whereas, quiet place and group work area availability were the worse with 342, 431 dissatisfied and more, 332, 286 highly satisfied ratings respectively.
Service Delivery
2.All the aspect in service delivery segment perform relatively well except for mobile devices accessibility to library online resources with 240 dissatisfied & more, 314 highly satisfied votes.
|
| 6
|
|
- Undergraduate from law that visit KGC law library had a different opinion on ‘opening hours’ in facilities & equipment segment as it is not their top choice in highly satisfied, instead it is one of the worse performing in facilities & equipment segment. Moreover, ‘printing, scanning, photocopying facilities’ is the top dissatisfaction in information resource segment. Therefore, SMU library may consider improving areas in opening hours and facilities of law library.
|
| 7
|
|
- Undergraduate from social sciences that visit LKS library had different opinions about clear signage in library as it is the highest dissatisfaction in communication segment, contradicting from all study area.
|
| 8
|
|
- Undergraduate that uses library resources daily have much smaller dissatisfaction in ‘anticipating of student learning & research needs’ and ‘workshops, classes, tutorial meet student learning & research needs’ as compare to the rest of the undergraduate. Hence, undergraduate that uses library resources daily might be better gauge for these 2 areas in facilities & equipment as they were the one that fully experience faculties & equipment frequently.
|
| 9
|
|
Satisfaction
- Overall library satisfaction of the undergraduate are skewed towards satisfactory side with very satisfied metrics having the majority votes.Satisfaction is within 28 – 35%, very satisfied is within 43% - 52%, highly satisfied is within 10% - 18%, neutral is within 2% -9%
|
| 10
|
|
Advocacy
- Overall library advocacy of the undergraduate are skewed towards passive and promoter with small gap between these parameters. SMU libraries are in between room for improvement and doing great for their NPS aspect.
|
Reference
<ref>https://www.datarevelations.com/resources/visualizing-net-promoter-score-data/<ref>
<ref>https://www.datarevelations.com/resources/rethinkingdivergent/<ref>
<ref>https://www.datarevelations.com/resources/got-likert-data-neutrals/<ref>
<ref>https://blog.hubspot.com/service/how-to-calculate-nps<ref>
<ref>https://www.udemy.com/course/tableau10-advanced/<ref>
Prof week 6 class exercise on divergent chart


