Difference between revisions of "IS428 AY2019-20T2 Assign JIANG XI"
| (22 intermediate revisions by the same user not shown) | |||
| Line 2: | Line 2: | ||
== Overview == | == Overview == | ||
| − | + | Every two years, SMU Libraries conduct a comprehensive survey in which faculty, students and staff have the opportunity to rate various aspects of SMU library's services. The survey provides SMU libraries with input to help enhance existing services and to anticipate emerging needs of SMU faculty, students and staff. | |
| − | == Objectives == | + | == Objectives for the VA Assignment == |
| + | To generate useful insights for the library management team to figure out the areas of improvements by analysing the survey feedback from the different user groups. | ||
| + | #the undergraduate students, | ||
| + | #the postgraduate students, | ||
| + | #the faculty, | ||
| + | #the staff. | ||
== Dataset == | == Dataset == | ||
There are 3 files have been provided to the student namely: | There are 3 files have been provided to the student namely: | ||
| + | <br> | ||
1. SMU Library Survey Comments MAC.xls > The text archive for the feedbacks | 1. SMU Library Survey Comments MAC.xls > The text archive for the feedbacks | ||
| Line 13: | Line 19: | ||
3. SMULibraries_BeHeardSurvey_FullReport.pdf > The sample result given by the external consultancy | 3. SMULibraries_BeHeardSurvey_FullReport.pdf > The sample result given by the external consultancy | ||
| + | <br> | ||
| − | === | + | == Data Preparation== |
| + | |||
| + | ===Remapping Values=== | ||
| + | Issue faced: | ||
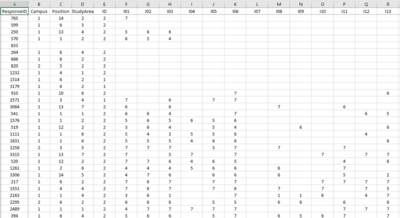
| + | The actual survey data has been encoded into the Enumerated type representations for better computing performance and smaller storage used. | ||
| + | However, it has dramatically increased the difficulty for the us to interpret the raw dataset as we have to conduct additional data mapping procedure. | ||
| + | <br> | ||
| + | |||
| + | [[File: RAW DATA.png|400px]] | ||
| + | <br> | ||
| + | Solution: | ||
| + | Since the excel has provided multiple useful formulae for mapping, I then decided to use them to retrieve the encoded values from the legend. | ||
| + | |||
| + | <br> | ||
| + | ====-<b>Step 1. Mapping for question headers</b>==== | ||
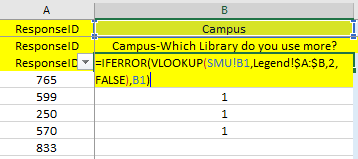
| + | Used Vloop function to match the Code and its question | ||
| + | |||
| + | Example for Campus-Which Library do you use more? | ||
| + | |||
| + | [[File:Which Library do you use more.png|400px]] | ||
| + | |||
| + | =IFERROR(VLOOKUP(SMU!B1,Legend!$A:$B,2,FALSE),B1) | ||
| + | <br> | ||
| + | |||
| + | ====-<b>Step 2. Mapping for question answers</b>==== | ||
| + | |||
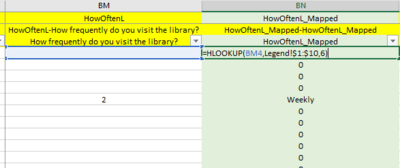
| + | Used Hloop function to match the Code and its answers of the following question. | ||
| + | |||
| + | Position (Select ONE that best describes you) | ||
| + | What is your major area of study, research or teaching? (Select ONE that best describes you) | ||
| + | Are you an international (non-exchange) student? | ||
| + | How frequently do you visit the library? | ||
| + | How frequently do you visit the Campus? | ||
| + | How often do you access library resources (e.g. online articles, databases, ebooks)? | ||
| + | <br> | ||
| + | Example : | ||
| + | =HLOOKUP(BM4,Legend!$1:$10,6) | ||
| + | <br> | ||
| + | [[File:Hlookup.png|400px]] | ||
| + | <br> | ||
| + | |||
| + | ===Invalid Values=== | ||
| + | ====<b>-Step 3. Indentifying Invalid inputs</b>==== | ||
| + | Use the 2 questions' response to create an additional column called "Valid" to check whether it is a usable data. | ||
| + | |||
| + | Which Library do you use more? | ||
| + | Position (Select ONE that best describes you) | ||
| + | |||
| + | [[File:INVALID.png|1400px]] | ||
| + | |||
| + | True : Valid | ||
| + | False: Invalid | ||
| + | |||
| + | Formula: =AND(B4>0,D4>0) | ||
| + | |||
| + | ====<b>-Step 4. Removing NA response </b>==== | ||
| + | Use excel to drop the Columns for NA-01 to 26. | ||
| − | |||
| − | == Data | + | Completed excel file: |
| + | [https://drive.google.com/file/d/12Nm0v64SLI2TlJULAiA5VVk7qGgY1-jo/view?usp=sharing Prepared data file] | ||
| + | |||
| + | == Data visualization == | ||
| + | [https://public.tableau.com/profile/jiangxi4511#!/vizhome/JIANGXI/Dashboard1?publish=yes Link] | ||
| + | |||
| + | ==Insights summary== | ||
| + | |||
| + | #Overall | ||
| + | #the undergraduate students, | ||
| + | #the postgraduate students, | ||
| + | #the faculty, | ||
| + | #the staff. | ||
Latest revision as of 00:10, 16 March 2020
Contents
Overview
Every two years, SMU Libraries conduct a comprehensive survey in which faculty, students and staff have the opportunity to rate various aspects of SMU library's services. The survey provides SMU libraries with input to help enhance existing services and to anticipate emerging needs of SMU faculty, students and staff.
Objectives for the VA Assignment
To generate useful insights for the library management team to figure out the areas of improvements by analysing the survey feedback from the different user groups.
- the undergraduate students,
- the postgraduate students,
- the faculty,
- the staff.
Dataset
There are 3 files have been provided to the student namely:
1. SMU Library Survey Comments MAC.xls > The text archive for the feedbacks
2. Raw data 2018-03-07 SMU LCS data file - KLG.xlsx > The raw data file with the legend
3. SMULibraries_BeHeardSurvey_FullReport.pdf > The sample result given by the external consultancy
Data Preparation
Remapping Values
Issue faced:
The actual survey data has been encoded into the Enumerated type representations for better computing performance and smaller storage used.
However, it has dramatically increased the difficulty for the us to interpret the raw dataset as we have to conduct additional data mapping procedure.

Solution:
Since the excel has provided multiple useful formulae for mapping, I then decided to use them to retrieve the encoded values from the legend.
-Step 1. Mapping for question headers
Used Vloop function to match the Code and its question
Example for Campus-Which Library do you use more?
=IFERROR(VLOOKUP(SMU!B1,Legend!$A:$B,2,FALSE),B1)
-Step 2. Mapping for question answers
Used Hloop function to match the Code and its answers of the following question.
Position (Select ONE that best describes you)
What is your major area of study, research or teaching? (Select ONE that best describes you)
Are you an international (non-exchange) student?
How frequently do you visit the library?
How frequently do you visit the Campus?
How often do you access library resources (e.g. online articles, databases, ebooks)?
Example :
=HLOOKUP(BM4,Legend!$1:$10,6)

Invalid Values
-Step 3. Indentifying Invalid inputs
Use the 2 questions' response to create an additional column called "Valid" to check whether it is a usable data.
Which Library do you use more? Position (Select ONE that best describes you)
True : Valid False: Invalid
Formula: =AND(B4>0,D4>0)
-Step 4. Removing NA response
Use excel to drop the Columns for NA-01 to 26.
Completed excel file:
Prepared data file
Data visualization
Insights summary
- Overall
- the undergraduate students,
- the postgraduate students,
- the faculty,
- the staff.
