Difference between revisions of "IS428 AY2019-20T2 Assign CHUA MING YU"
Jump to navigation
Jump to search
| Line 64: | Line 64: | ||
=Graphs and insights= | =Graphs and insights= | ||
===Undergraduates=== | ===Undergraduates=== | ||
| + | |||
| + | {| class="wikitable" style="margin-left: auto; margin-right: auto; width: 100%; | ||
| + | |- | ||
| + | ! style="font-family:Verdana; background: #3b3b3b;color:#fbfcfd;width: 3%;font-size:18px;" |Number | ||
| + | ! style="font-family:Verdana; background: #3b3b3b;color:#fbfcfd;width: 15%;font-size:18px;" |Screenshot | ||
| + | ! style="font-family:Verdana; background: #3b3b3b;color:#fbfcfd;width: 15%;font-size:18px;" |Insights | ||
| + | |||
| + | |- | ||
| + | |1 | ||
| + | | | ||
| + | [[File:Resourceutilization(never).png|400px|center]] | ||
| + | |Almost all undergraduates who responded have visited the library before, whereas there are a few undergraduates who have not utilized the library resources before. There may be an underlying issue here about how undergraduates do not know how to access the library services, and that more could be done to educate undergraduates on how to access library resources. | ||
| + | |||
| + | |- | ||
| + | |2 | ||
| + | | | ||
| + | [[File:Nps scoring v2.png|400px|center]] | ||
| + | |Undergraduates here are likely to recommend the library to others. Even though their scoring is lowest among all 4 groups, however it is still positive. | ||
| + | |||
| + | |- | ||
| + | |3 | ||
| + | | | ||
| + | [[File:Performance facilities.png|400px|frameless|center]] | ||
| + | |It seems that there is a huge difference in the perceived importance of the facilities in the library, and its actual performance. Among all the undergraduates who rate the facilities as important, there is a gap of 29.2% in the number of users who rate the actual performance of the library as high. | ||
| + | |||
| + | |- | ||
| + | |4 | ||
| + | | | ||
| + | [[File:Response facilities.png|400px|center]] | ||
| + | |Examining the issue further by looking into the individual questions for the category, facilities, we notice that the main causes for the gap in performance and importance lies in users being unable to find places in the library to conduct group work, and that the library is too noisy. Since the survey was done in 2018, with the recent opening of SMU connexion, we might see improvements in the amount of spaces available for undergraduates to conduct group work. As for the noise levels in the library, more could be done by the library to get users to keep their volume as low as possible. | ||
| + | |||
| + | |- | ||
| + | |5 | ||
| + | | | ||
| + | | | ||
| + | |||
| + | |- | ||
| + | |6 | ||
| + | | | ||
| + | | | ||
| + | |||
| + | |- | ||
| + | |7 | ||
| + | | | ||
| + | | | ||
| + | |||
| + | |- | ||
| + | |8 | ||
| + | | | ||
| + | | | ||
| + | |||
| + | |- | ||
| + | |9 | ||
| + | | | ||
| + | | | ||
| + | |||
| + | |- | ||
| + | |10 | ||
| + | | | ||
| + | | | ||
| + | |||
| + | |||
| + | |} | ||
===Graduates=== | ===Graduates=== | ||
Revision as of 21:02, 15 March 2020
IS428 Visual Analytics for Business Intelligence
Contents
Overview
Every two years, SMU Libraries conduct a comprehensive survey in which faculty, students and staff have the opportunity to rate various aspects of SMU library's services. The survey provides SMU libraries with input to help enhance existing services and to anticipate emerging needs of SMU faculty, students and staff.
The interactive tableau chart can be found at here [1]
Data Preperation
Tableau Prep was used to process the data given in "Raw data 2018-03-07 SMU LCS data file - KLG.xlsx"
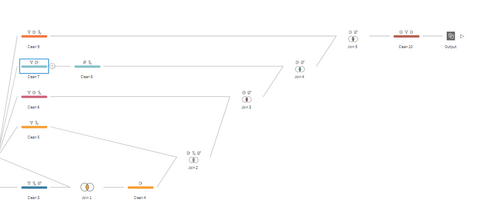
The overall steps look like:
Below will be a step by step guide of what I did to get the final output.
| Screenshot | Steps |
|---|---|
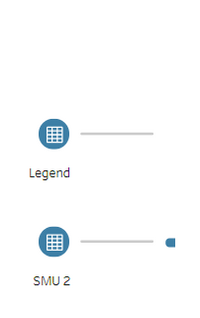
| I added both sheets into tableau prep | |
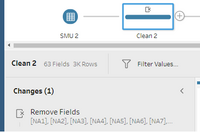
| I removed all the responses where respondents responded that it is not applicable to them | |
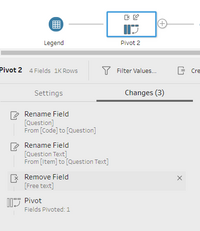
| I pivoted the values so that instead of having multiple responses to multiple questions in one row, each row will represent one response to one question | |
| I renamed several columns so that the headers have more meaning. Then I pivoted it so that there will be one row per question and answer. | |
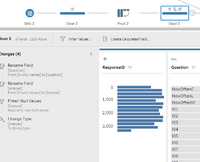
|
|
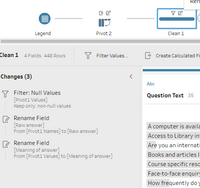
I filtered out all the null values that appear due to the previous pivot step. |
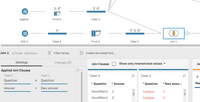
| I did an inner join on both sheets so that I can get all the responses and their corresponding meaning | |
| I used a whole bunch of merge statements to replace the responses for Position, StudyArea, ID, Campus. This allows for the values to have meaning instead of staying as numbered responses. |
Graphs and insights
Undergraduates
| Number | Screenshot | Insights |
|---|---|---|
| 1 | Almost all undergraduates who responded have visited the library before, whereas there are a few undergraduates who have not utilized the library resources before. There may be an underlying issue here about how undergraduates do not know how to access the library services, and that more could be done to educate undergraduates on how to access library resources. | |
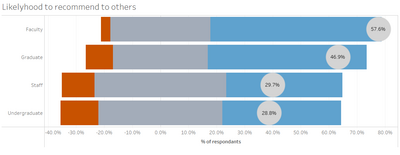
| 2 | Undergraduates here are likely to recommend the library to others. Even though their scoring is lowest among all 4 groups, however it is still positive. | |
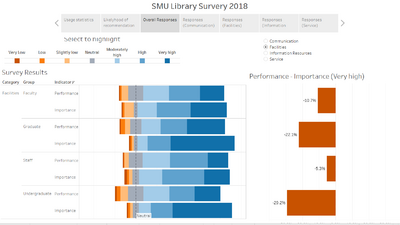
| 3 | It seems that there is a huge difference in the perceived importance of the facilities in the library, and its actual performance. Among all the undergraduates who rate the facilities as important, there is a gap of 29.2% in the number of users who rate the actual performance of the library as high. | |
| 4 | Examining the issue further by looking into the individual questions for the category, facilities, we notice that the main causes for the gap in performance and importance lies in users being unable to find places in the library to conduct group work, and that the library is too noisy. Since the survey was done in 2018, with the recent opening of SMU connexion, we might see improvements in the amount of spaces available for undergraduates to conduct group work. As for the noise levels in the library, more could be done by the library to get users to keep their volume as low as possible. | |
| 5 | ||
| 6 | ||
| 7 | ||
| 8 | ||
| 9 | ||
| 10 |
|

