Difference between revisions of "IS428 AY2019-20T2 Assign KHEMKA SHIVIKA"
| Line 95: | Line 95: | ||
</p> | </p> | ||
| − | ==<div style="background:#143c67; padding: 15px; font-weight: bold; line-height: 0.3em;font-size:20px"><font color=#fbfcfd face="Helvetica"><center>VISUALIZATION</center></font></div>== | + | ==<div style="border:2px solid #996515;background:#143c67; padding: 15px; font-weight: bold; line-height: 0.3em;font-size:20px"><font color=#fbfcfd face="Helvetica"><center>VISUALIZATION</center></font></div>== |
==<div style="background:#143c67; padding: 15px; font-weight: bold; line-height: 0.3em;font-size:20px"><font color=#fbfcfd face="Helvetica"><center>INTERACTIONS</center></font></div>== | ==<div style="background:#143c67; padding: 15px; font-weight: bold; line-height: 0.3em;font-size:20px"><font color=#fbfcfd face="Helvetica"><center>INTERACTIONS</center></font></div>== | ||
Revision as of 16:16, 15 March 2020
|
LIBRARY SURVEY 2018 |
Contents
PROBLEM & MOTIVATION
PROBLEM
The SMU Libraries are used for several purposes ranging from information access and a quiet place to study to computer and printing services. The library conducts a survey every two years to try and enhance their service quality. They ask some pertinent questions and collect useful data, but the reports generated are long and difficult to comprehend because of which the Libraries aren't able to make relevant improvements.
MOTIVATION
As an undergraduate student at SMU, the library is an essential part of my university experience and I would like to help the administration better understand the results of their survey. As a respondent myself, I have been given the rare opportunity to ensure that my feedback is well analysed and I would like to make the most of it.
DATA PREPARATION
MODIFICATIONS
| Tool | Tasks and Modifications |
|---|---|
|
Microsoft Excel |
|
|
Tableau Prep |
|
TABLEAU PREP FLOW
DATA TRANSFORMATION
| Original Data | Processed Data |
|---|---|
|
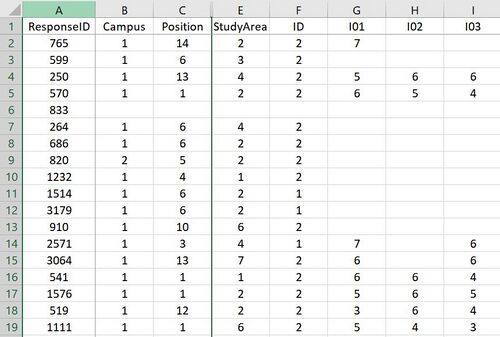
Size: 2639 rows and 90 columns |
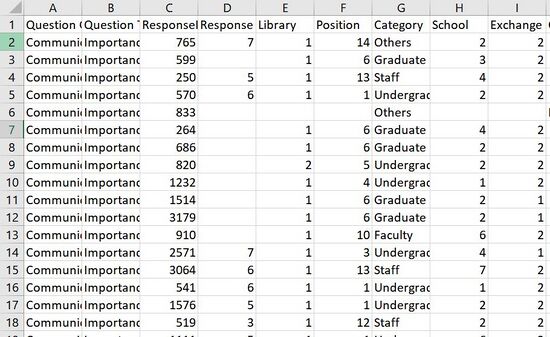
Size: 150423 rows and 12 columns |
STORYBOARD
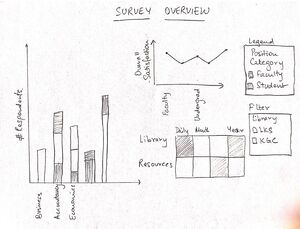
SKETCH 1: Survey Overview Dashboard
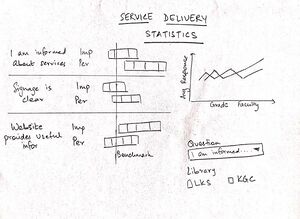
SKETCH 2: Survey Results Dashboard
VISUALIZATION
INTERACTIONS
INSIGHTS
KEY TECHNICAL CHALLENGES & MITIGATION
| No. | Challenge | Description | Mitigation |
|---|---|---|---|
| I was first using the data without any reshaping and modification. The original data is very difficult to use in Tableau because each of the questions was considered another dimension. | I watched a few videos published by Tableau where survey data was reshaped to get some direction. After using Tableau Prep to pivot and process the data, imagining the visualizations became much easier. | ||
| I was initially trying to put in everything there was in the dataset into the dashboards. I realized that the idea was not useful and could potentially confuse the viewer. For example, I was trying to add the individuals positions (Faculty-Professor, Faculty-Lecturer) when the question clearly stated that the analysis should be based on "Faculty" as a single category. | I drilled down on the task given in the assignment and tried to focus on the questions and responses rather than making my assignment complicated by adding unnecessary details. |
COMMENTS
Do leave a comment on how I can improve my visualizations so as to be able to provide more value to the SMU Library Administration or if you require any files for reference!
| No. | Name | Date | Comments |
|---|---|---|---|
| 1. | (Name) | (Date) | (Comment) |
| 2. | (Name) | (Date) | (Comment) |
| 3. | (Name) | (Date) | (Comment) |


