Difference between revisions of "IS428 AY2019-20T2 Assign JORDY NELSON SAMUEL"
| Line 19: | Line 19: | ||
|- | |- | ||
|[[File:Pivot jnsamuel.jpg|400px|frameless|center]] | |[[File:Pivot jnsamuel.jpg|400px|frameless|center]] | ||
| − | |We can now drag in the 'Legend' sheet and inner join them by 'Code'. This will allow us to have the 2 columns, Item and Rating, that will enable us to plot our visualisations. | + | | We can now drag in the 'Legend' sheet and inner join them by 'Code'. This will allow us to have the 2 columns, Item and Rating, that will enable us to plot our visualisations. |
| − | } | + | |} |
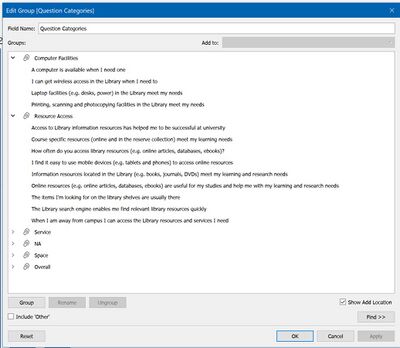
In addition, to better evaluate the services the library provides, each question has been grouped into respective categories that evaluate the computer facilities, overall satisfaction, resource access, service and the space of the library. | In addition, to better evaluate the services the library provides, each question has been grouped into respective categories that evaluate the computer facilities, overall satisfaction, resource access, service and the space of the library. | ||
Revision as of 18:27, 13 March 2020
Overview
The 2018 dataset for the library survey has been used. In general, we are trying to get a picture through this visualisation of who uses the library, what they use it for and how well the library has been serving them.
Data & Preparation
| Screenshot | Description |
|---|---|
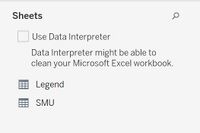
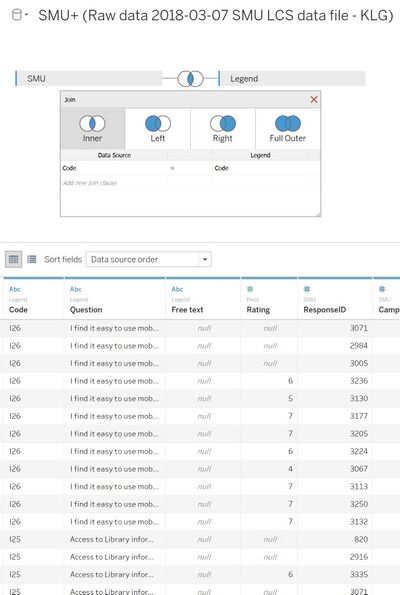
| The data comes in 2 sheets: SMU and Legend. SMU contains all the actual responses, while Legend contains all the codes for the questions and responses. | |
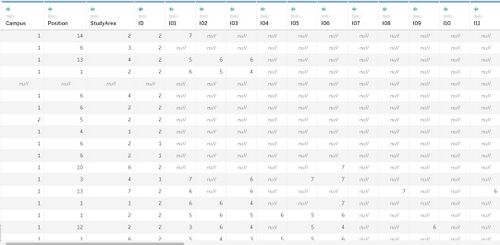
| Upon importing the SMU sheet, we can see that while the legend and ratings are available, the actual questions are not. We must proceed to import the Legends sheet as well, but first, we must treat this data. Tableau does not like this format where every question has its own column, therefore we need to pivot it. | |
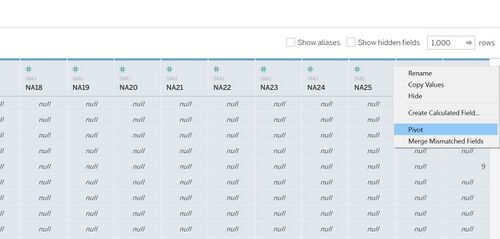
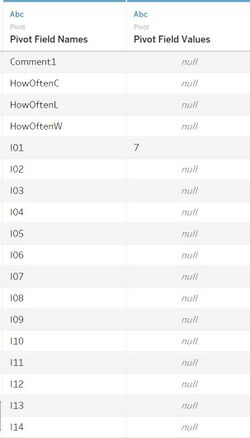
| We select all the columns from I01 to NPS1 and pivoted them into 2 fields as shown in the second image. This will allow tableau to manipulate the data easier when we build our likert scale and various other graphs. We shall rename 'Pivot Field Names' to 'Code' and 'Pivot Field Values' to 'Rating'. | |
| We can now drag in the 'Legend' sheet and inner join them by 'Code'. This will allow us to have the 2 columns, Item and Rating, that will enable us to plot our visualisations. |
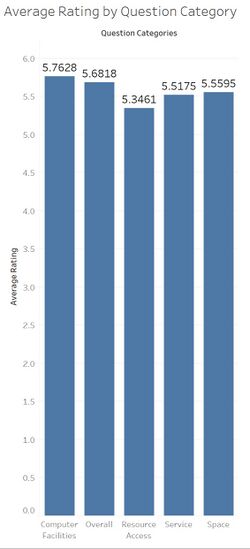
In addition, to better evaluate the services the library provides, each question has been grouped into respective categories that evaluate the computer facilities, overall satisfaction, resource access, service and the space of the library.
The 5 groups are Computer Facilities, Resource Access, Service, Space and Overall. These categories will help us to evaluate different aspects of the libraries' service.
Demographics
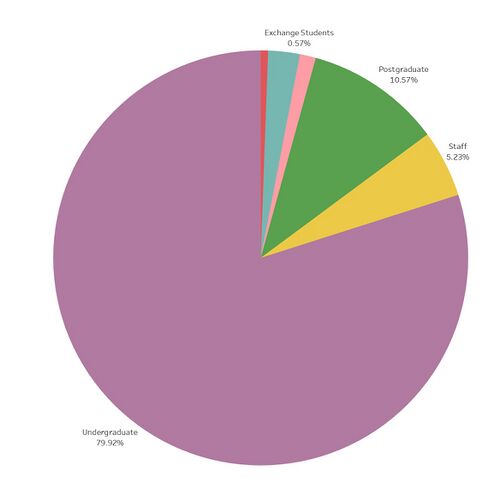
The primary audience of the survey is undergraduate students, taking up 79.92%(158,175) of the survey's respondents. Postgraduate students are second at 10.57%(20,925) respondents.
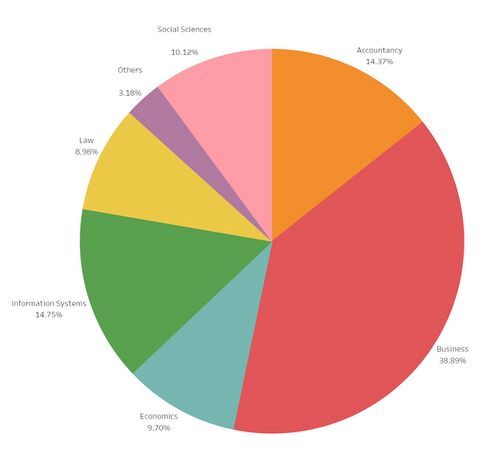
In proportion to the overall demographics of SMU, Business students take up 38.89%(76,950) of the respondents, the largest among the other schools. Information Systems comes in second, with about half of Business's students at 14.75% (29,175) of the total students.
Overall Results
Service Scores
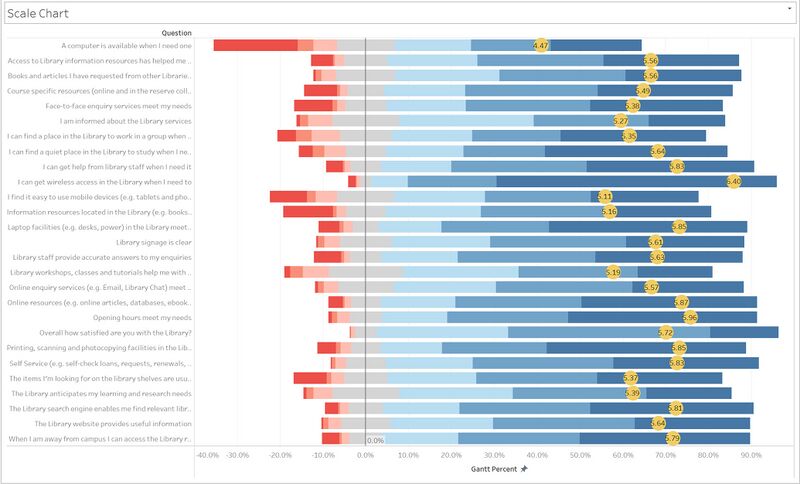
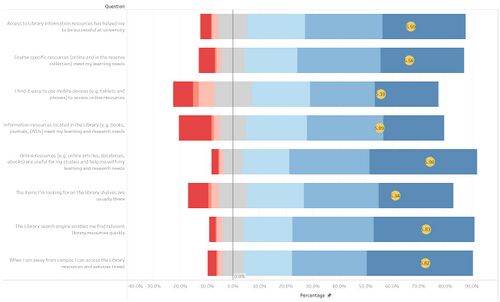
The overall results from the survey are encouraging. The survey is conducted on a scale of 1-7. The lowest average score per question is 4.47, while the highest is 6.40; none of the questions overall scored below the neutral score of 4.
The most positive question is 'I can get wireless access in the Library when I need to', at an average of 6.40 out of 7. The most negative is 'A computer is available when I need one', at an average of 4.47 out of 7.
In general, the questions that are the most 'extreme' in response tends to be regarding electronic resources and finding them: questions like 'The library search engine enables me to find relevant resources quickly' scored a high 5.81 out of 7.
Visitation
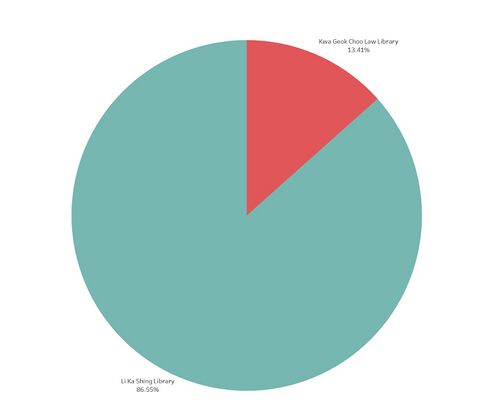
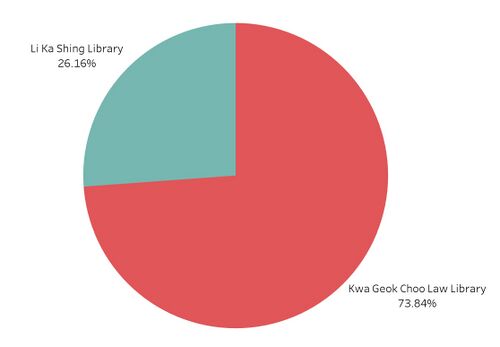
Li Ka Shing is still the most popular library, with 86.55%(171,300) respondents claiming to go there, while the Kwa Geok Choo Law Library is second with 13.41%(26,550) of respondents claiming to go there. If you play with the filter through the full visualisation, you will notice that this proportion is roughly the same, with the notable exception being Law students; 73.84%(13,125) of law students use the Law Library more often, with only 26.16%(4,650) using the Li Ka Shing library.
In general, however, across all groups, visits to the library happen often, with, on average, people visiting the library at least weekly. This is rather consistent across the campuses, positions and areas of study.
Undergraduates
Undergraduates are satisfied using their personal laptops in the library, but computers at the library are not always available.
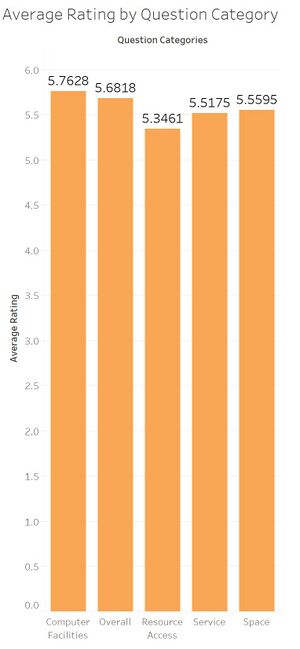
Undergraduates rated the computer facilities when it comes to using their own laptops very highly in comparison to other fields, excluding their overall satisfaction. This indicates that undergraduates use the library as a study space for a good portion of the time they are at the library, as they have a strong, positive opinion of using their own laptops.
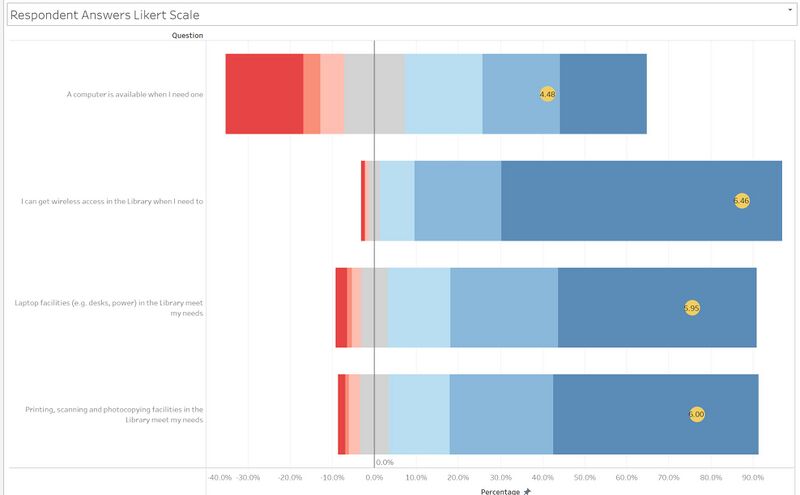
When it comes to the scale chart however, if 'Computer Facilities' under question categories and 'Undergraduate' is selected for Position, we can see that undergraduate students need access to the computers in the library, but may not always be able to get one. For the question 'A computer is available when I need one', almost 40% of respondents answered negatively. With an average score of 4.48 amongst the group, the response is barely positive (4 being a neutral score).
In fact, amongst all the survey question, the availability of computers scores the worst, with the largest proportion of undergraduate respondents responding negatively. It also has the lowest mean score across all the questions.
This applies to both libraries, Kwa Geok Choo Law Library and Li Ka Shing Library. Sentiments across the board for this category of questions is roughly the same; students love studying at both libraries, but find the availability of computers lacking. This difference can be seen by toggling the 2 libraries back and forth in the full visualisation.
Li Ka Shing is still the most popular library... except amongst law students
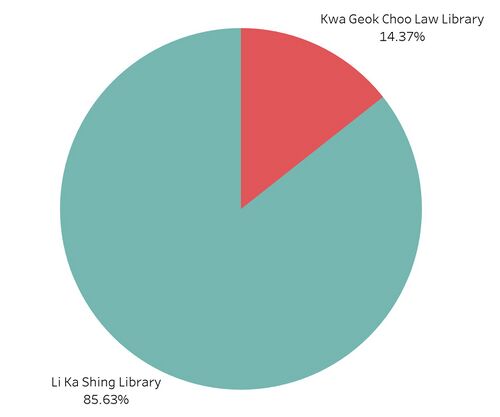
Looking at which library is more popular, Li Ka Shing is the definite winner. 85.63%(135,450) visit Li Ka Shing library more often, an overwhelming majority.
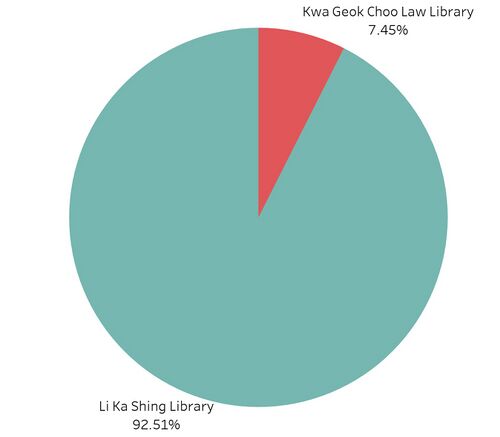
What if we looked at just non-law students? The difference is further exacerbated.
We now see that Li Ka Shing is an even more overwhelming majority at 91.44% popularity amongst non-law students.
What about Law students?
We now see that law students overwhelmingly prefer the law library, with 71.65% preferring to visit. Proximity could be one factor, but could the difference be because of other factors?
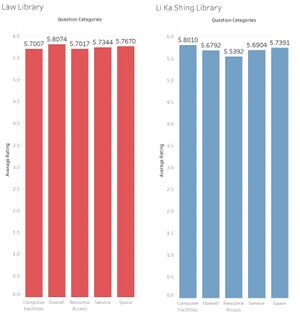
We can compare law students' rating average over categories.
While answers differ across the board, we can see that overall, law students are more satisfied with the Law library, with an overall rating of 5.8074 vs 5.6792 in Li Ka Shing. The most notable difference is Resource Access, with a 0.1625 higher rating in the Law Library. Since law students need their own set of resources different from the other schools, it makes sense to say that the reason why law students overwhelmingly choose the Law Library is due to the access of resources it provides.
Resource Access is Everyone's Big Gripe
On average, access to resources is the worst rated category among all questions. At 5.3461 average, it is the worst scoring among all categories.
Drilling down into the questions for this category, the worst question is 'Information resources located in the Library (e.g. books, journals, DVDs) meet my learning and research needs' at 5.09 out of 7. So is there a mismatch with the libraries' provision of resources and students' needs?
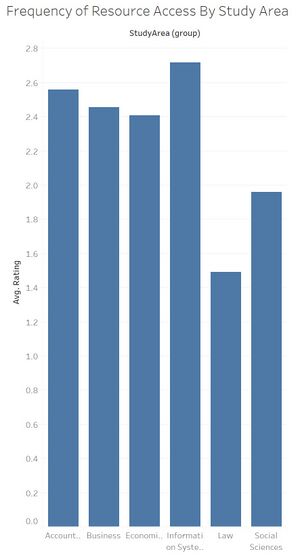
Let's take a look at the responses for the question, 'How often do you access library resources'. The page on the full visualisation is here
The lower the rating, the more frequently students from that study area access resources. Let's first take note that students from Law and Social Sciences access resources the most, at 1.4 and 1.9 respectively.
