Difference between revisions of "IS428 AY2019-20T2 Assign JORDY NELSON SAMUEL"
| Line 16: | Line 16: | ||
== Overall Results == | == Overall Results == | ||
| + | === Service Scores === | ||
[[File:Likert.jpg|frameless|center]] [https://public.tableau.com/profile/jordy.nelson.samuel#!/vizhome/Assignment1_jnsamuel_2016/ScaleChart Full Visualisation] | [[File:Likert.jpg|frameless|center]] [https://public.tableau.com/profile/jordy.nelson.samuel#!/vizhome/Assignment1_jnsamuel_2016/ScaleChart Full Visualisation] | ||
| + | The overall results from the survey are encouraging. The survey is conducted on a scale of 1-7. The lowest average score per question is 4.47, while the highest is 6.40; none of the questions overall scored below the neutral score of 4. | ||
| + | |||
| + | The most positive question is 'I can get wireless access in the Library when I need to', at an average of 6.40 out of 7. The most negative is 'A computer is available when I need one', at an average of 4.47 out of 7. | ||
| + | |||
| + | In general, the questions that are the most 'extreme' in response tends to be regarding electronic resources and finding them: questions like 'The library search engine enables me to find relevant resources quickly' scored a high 5.81 out of 7. | ||
Revision as of 17:50, 12 March 2020
Overview
The 2018 dataset for the library survey has been used.
Data & Preparation
The data comes in 2 sheets: SMU and Legend. SMU contains all the actual responses, while Legend contains all the codes for the questions and responses. In Tableau, we pivot the SMU sheet such that all the codes are under one column instead of their own, as well as the responses. We then inner join this with the Legend's code, such that we can display the actual question while visualising our data.
Demographics
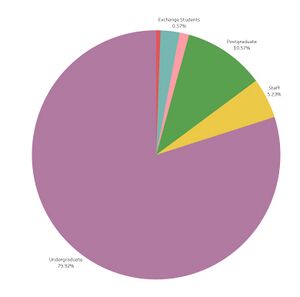
The primary audience of the survey is undergraduate students, taking up 79.92%(158,175) of the survey's respondents. Postgraduate students are second at 10.57%(20,925) respondents.
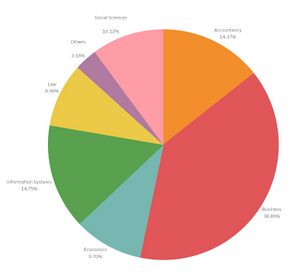
In proportion to the overall demographics of SMU, Business students take up 38.89%(76,950) of the respondents, the largest among the other schools. Information Systems comes in second, with about half of Business's students at 14.75% (29,175) of the total students.
Overall Results
Service Scores
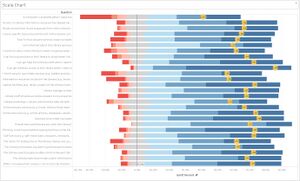
The overall results from the survey are encouraging. The survey is conducted on a scale of 1-7. The lowest average score per question is 4.47, while the highest is 6.40; none of the questions overall scored below the neutral score of 4.
The most positive question is 'I can get wireless access in the Library when I need to', at an average of 6.40 out of 7. The most negative is 'A computer is available when I need one', at an average of 4.47 out of 7.
In general, the questions that are the most 'extreme' in response tends to be regarding electronic resources and finding them: questions like 'The library search engine enables me to find relevant resources quickly' scored a high 5.81 out of 7.


