Difference between revisions of "IS428 AY2019-20T2 Assign JORDY NELSON SAMUEL"
| Line 3: | Line 3: | ||
== Data & Preparation == | == Data & Preparation == | ||
| − | + | The data comes in 2 sheets: SMU and Legend. SMU contains all the actual responses, while Legend contains all the codes for the questions and responses. | |
| + | In Tableau, we pivot the SMU sheet such that all the codes are under one column instead of their own, as well as the responses. We then inner join this with the Legend's code, such that we can display the actual question while visualising our data. | ||
| Line 13: | Line 14: | ||
[[File:Studyarea.jpg|frameless|left]] [https://public.tableau.com/profile/jordy.nelson.samuel#!/vizhome/Assignment1_jnsamuel_2016/StudyArea Full Visualisation] | [[File:Studyarea.jpg|frameless|left]] [https://public.tableau.com/profile/jordy.nelson.samuel#!/vizhome/Assignment1_jnsamuel_2016/StudyArea Full Visualisation] | ||
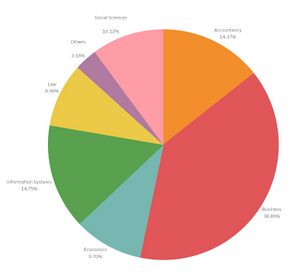
In proportion to the overall demographics of SMU, Business students take up 38.89%(76,950) of the respondents, the largest among the other schools. Information Systems comes in second, with about half of Business's students at 14.75% (29,175) of the total students. | In proportion to the overall demographics of SMU, Business students take up 38.89%(76,950) of the respondents, the largest among the other schools. Information Systems comes in second, with about half of Business's students at 14.75% (29,175) of the total students. | ||
| + | |||
| + | == Overall Results == | ||
| + | [[File:Likert.jpg|frameless|left]] [https://public.tableau.com/profile/jordy.nelson.samuel#!/vizhome/Assignment1_jnsamuel_2016/ScaleChart Full Visualisation] | ||
Revision as of 15:15, 12 March 2020
Overview
The 2018 dataset for the library survey has been used.
Data & Preparation
The data comes in 2 sheets: SMU and Legend. SMU contains all the actual responses, while Legend contains all the codes for the questions and responses. In Tableau, we pivot the SMU sheet such that all the codes are under one column instead of their own, as well as the responses. We then inner join this with the Legend's code, such that we can display the actual question while visualising our data.
Demographics
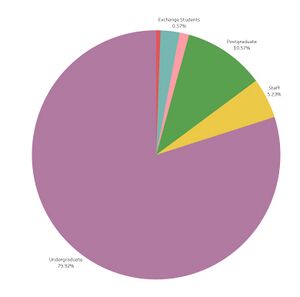
The primary audience of the survey is undergraduate students, taking up 79.92%(158,175) of the survey's respondents. Postgraduate students are second at 10.57%(20,925) respondents.
In proportion to the overall demographics of SMU, Business students take up 38.89%(76,950) of the respondents, the largest among the other schools. Information Systems comes in second, with about half of Business's students at 14.75% (29,175) of the total students.


