SMT201 AY2019-20T1 EX2 Soh Bai He
Contents
Objective
To identify a location in Gombak planning subzone that is suitable for building a National Communicable Disease Quarantine Centre, the following decision factors are studied in this report:
1. Accessibility Factor: The selected site should be close to existing service roads and tracks, to ensure the ease of transportation of resources during the construction of the Centre.
2. Health Risk Factor: The selected site should be away from the population in order to avoid the spread of the disease.
3. Natural Conservation Factor: The selected site should be away from forested land, park and water.
4. Economic Factor: The selected site should avoid steep slope to as it involves a lot of cut-and-fill which would lead to relatively higher development cost.
Data Source
| Name | Format | Source |
|---|---|---|
| Master Plan 2014 Subzone Boundary (No Sea) | shapefile | data.gov |
| Roads, Buildings, Natural | shape | OpenStreetMap |
| ASTER DEM | Raster | NASA |
Features of Interest
Accessibility Factor (Roads)
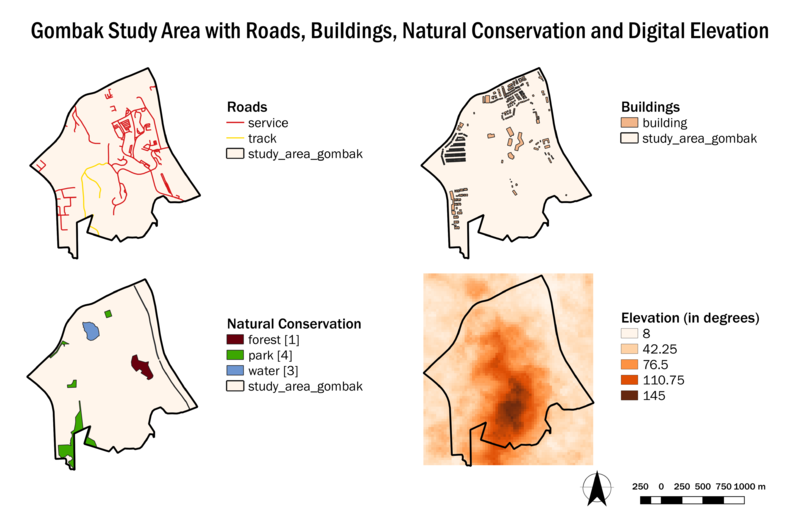
Service roads and tracks are of concern for our analysis. Hence, they are extracted from OSM roads data. They are concentrated in the north and east areas of Gombak. Overall, road network in Gombak is sparse.
Health Risk Factor (Buildings)
All buildings are treated as population indicators. In general, the Centre should be kept away and isolated from all buildings. Therefore, classifying buildings will not be meaningful for our analysis. It can be observed that the southern area of Gombak is lacking buildings.
Natural Conservation Factor (Natural Features)
There are 1 forest, 4 parks and 3 waterbodies identified.
Economic Factor (Elevation)
The lowest point in Gombak is 8 degrees above sea level, while the highest point is 145 degrees. Natural features are located within the low-lying areas of Gombak while the highest point of elevation can be observed in the southern area of Gombak.
Proximity Analysis
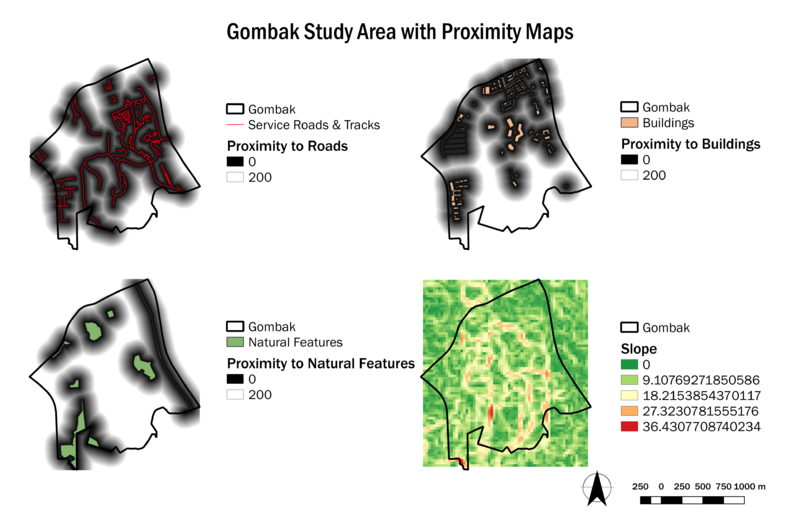
Before land suitability analysis is conducted to select a suitable land for the Centre, a proximity analysis is necessary to display the closeness of land lots in Gombak to the features related to each decision factor. The proximity maps are standardized to show the proximity range of 0 to 200m to ensure uniformity in comparison.
Proximity to Roads
The areas in black are closer to service roads and tracks. They are more suitable for the building of the Centre as they indicate higher accessibility. The proximity from roads to a piece of 5m² land varies from 0 to 717.025m.
Proximity to Buildings
The areas in white are further away from the buildings. They are more suitable for the building of the Centre as they are further away from the population which would pose lesser health risk to the population. The proximity from buildings to a piece of 5m² land varies from 0 to 816.364m.
Proximity to Natural Features
The areas in white are further away from natural features. They are more suitable for the building of the Centre as it would reduce damage to natural features and animals. The proximity from natural features to a piece of 5m² land varies from 0 to 848.116m.
Slope
The areas in green do not have steep slopes. They are more suitable for the building of the Centre as it would reduce cost. The steepness of the slope varies from 0 to 36.4308 degrees.
Criterion Scores
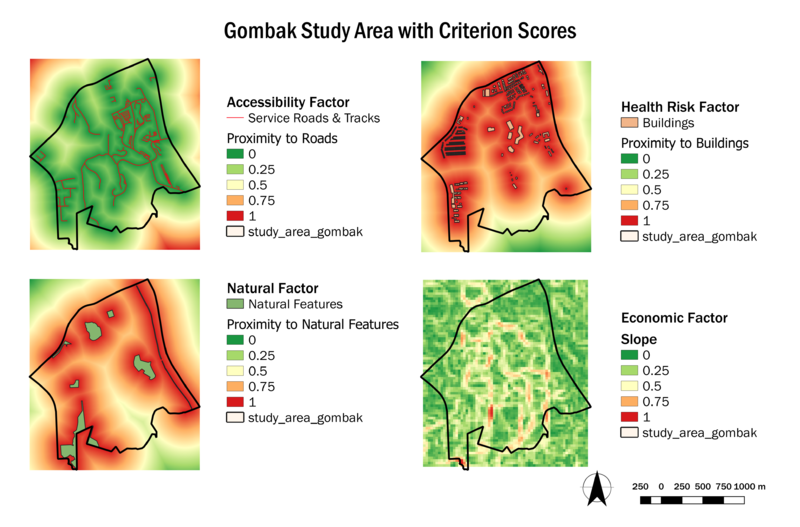
To obtain criterion score maps, I took the following steps:
1) Inverse the values of proximity maps depicting buildings and natural features
This is because for the proximity maps depicting roads and slope, the areas closer to roads and areas without steep slopes are preferred. In contrast, for the proximity maps depicting buildings and natural features, the areas further away from buildings and natural features are preferred. Therefore, the inversion of values is necessary for easier comparison.
| Factors | Criterion Score |
|---|---|
| Accessibility | Proximity to Roads |
| Health Risk | 1 - Proximity to Buildings |
| Natural Conservation | 1 - Proximity to Natural Features |
| Economic | Slope |
2) Standardize all maps by the min-max formula
Formula: (Proximity Map to Feature - Minimum Value of Proximity to Feature) / (Maximum Value of Proximity to Feature - Minimum Value of Proximity to Feature)
| Factors | Standardized Criterion Score |
|---|---|
| Accessibility | (Proximity to Roads - 0)/(717.025-0) |
| Health Risk | (Inverse Proximity to Buildings - (-816.364))/(1 - (-816.364)) |
| Natural Conservation | (Inverse Proximity to Natural Features - (-848.116))/(1 - (-848.116)) |
| Economic | (Proximity to Slope - 0)/(36.4308-0) |
All standardized criteria scores range from 0 to 1. Land lots with lower criterion scores are more suitable for the building of the Centre.
AHP Scoring Matrix
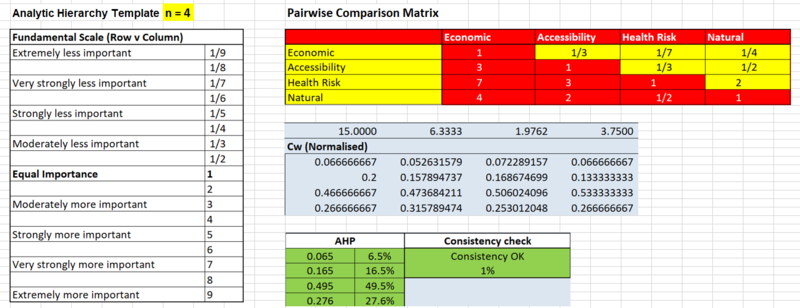
The Analytic Hierarchy Template (AHP) is used to rank the relative importance of decision factors. The decision factor with the highest score will be the most important factor.
| Ranking | Decision Factor | Reason |
|---|---|---|
| 1 | Health Risk | Patients who have contracted the disease should be isolated from the population in Gombak, to prevent the spread of the disease. As a small country, once disease hit buildings that are densely populated, it would be easy for the disease to spread to the rest of the population. |
| 2 | Natural Conservation | If the disease were to be airborne, cross-infect with animals or contaminate water resources, it could cause widespread infection. |
| 3 | Accessibility | Accessibility is important to facilitate the ease of transportation of patients and resources to the Centre. However, it is relatively less important when compared to the 2 factors above, as Health Risk and Natural Conservation are factors that concern the possibility of the disease being widespread, which should be prevented. |
| 4 | Economic | The cost of construction should not be made a priority when weighed against the other 3 factors above, as building the Quarantine Centre is a necessity to keep the disease away from the population. Human capital is very important to Singapore as a small country with limited resources. Therefore, it is relatively more important for the factors (Health Risk, Natural Conservation, Accessibility) to be met, for the Centre to be well-functioning after it is built and protect the well-being of the population. |
Land Suitability Map
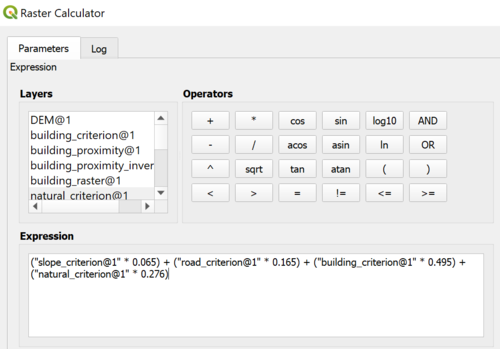
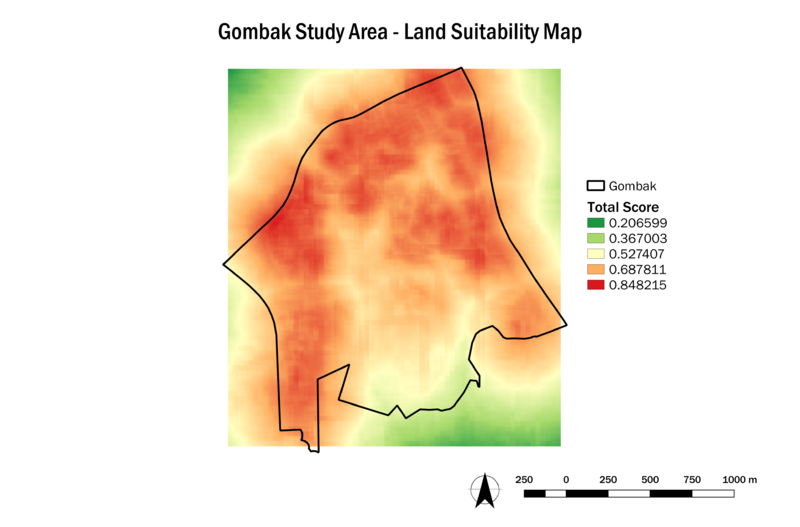
A land suitability map is derived from the combination of the AHP scores and criterion maps. To obtain the land suitability map, each criterion map is multiplied by the weight of its corresponding factor using the Raster Calculator:
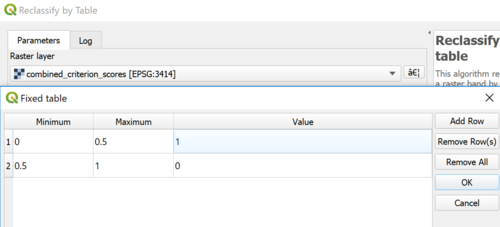
In order to choose the most suitable land lot(s) to build the Centre, I used the Reclassify by Table function. Areas with the score of 0 to 0.5 are assigned the value of 1 (suitable), while areas with the score of more than 0.5 are assigned the value of 0 (unsuitable).
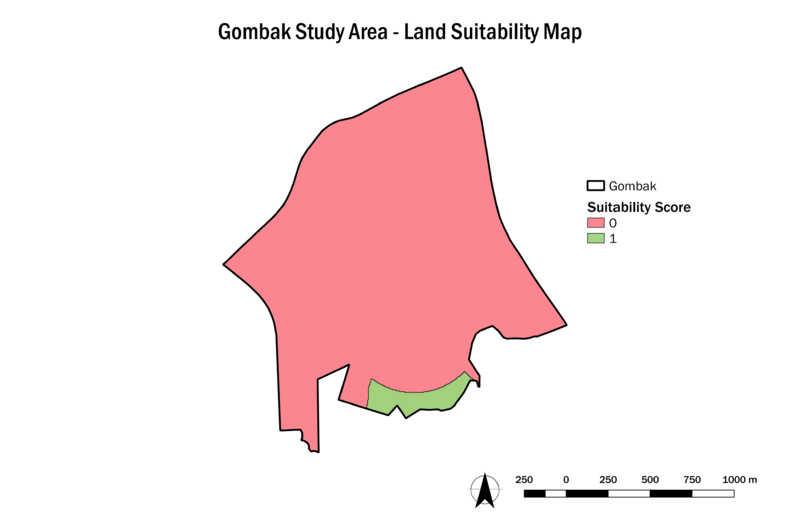
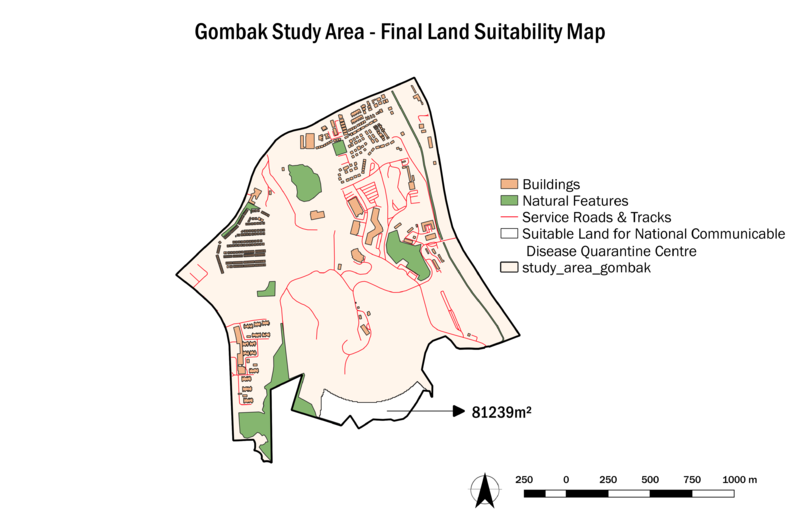
The reclassified land suitability map is then converted into a vector using the Polygonize function. After which, I clipped the resulting map to the Gombak subzone layer. The final land suitability map is derived:
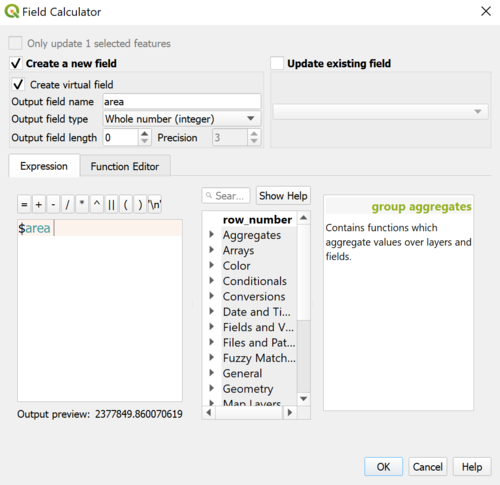
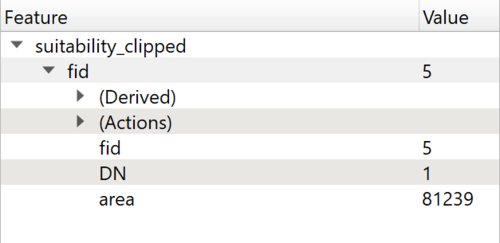
The area of the final suitable land is 81239m², calculated using the Open Field Calculator and adding a column with ‘$area’. It meets the criteria of being a contiguous area of at least 10000m². It is also situated far away from the population, which meets the most important factor – Health Risk.
