SMT201 AY2019-20T1 EX2 Chong Yun Yu
Contents
Building a National Communicable Disease Quarantine Centre
To identify a location suitable for building a National Communicable Disease Quarantine Centre, there is a need to first look at the points of interests in Gombak planning subzone. Four decision factors that are particularly relevant have been identified:
- Accessibility factor: proximity to local roads, such as service roads and tracks
- Health risk factor: proximity to population, in particular proximity to buildings
- Natural conservation factor: proximity to natural features, such as parks, forests, and water bodies
- Economic factor: steepness of slope
These factors will be discussed in more detail below.
Data Source: Master Plan 2014 Subzone Boundary (No Sea) (SHP) from URA.[4]. Roads, Buildings and Natural (SHP) from OpenStreetMap.[5]. ASTER Global Digital Elevation Model (GDEM) dataset (TIFF) jointly prepared by NASA and METI, Japan; raster dataset combined by Professor Kam Tin Seong.[6].
Accessibility Factor (Roads)
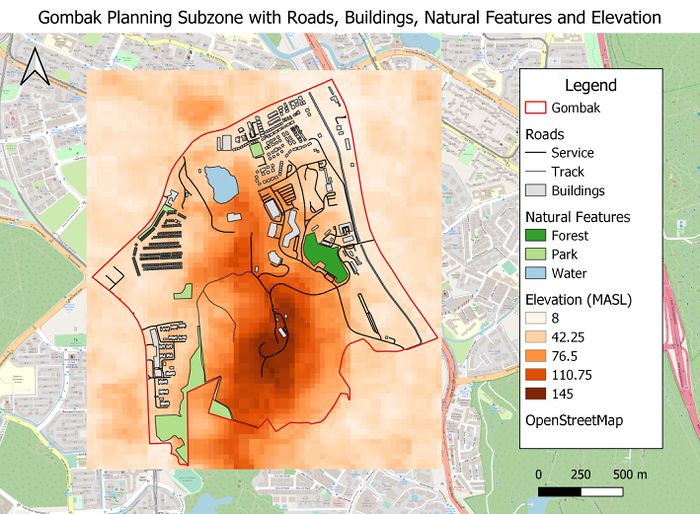
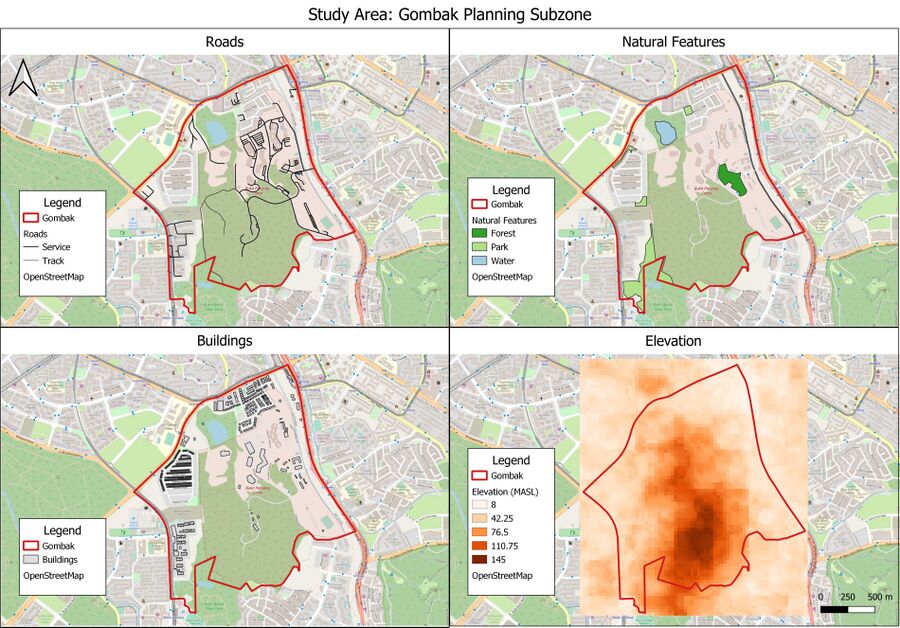
The selected site should be close to local roads to ensure easy transportation of building materials during the construction stage. The roads are shown in a line vector, and are categorized into service roads, which are shown using thicker strokes; and tracks, which are shown using thinner strokes. There are 199 service roads and only 2 tracks. The service roads spread across most of the Gombak planning subzone, and are mostly concentrated in the North-East region, whereas the 2 tracks are located in central region of Gombak and connecting to other roads in the South of Gombak.
Health Risk Factor (Buildings)
The selected site should be away from population to prevent the diseases from spreading to the public. Seven types of buildings have been identified from the data provided from OpenStreetMap, they include clinic, construction site, garage, place of worship, public space, residential area, and train station. However, out of the 527 buildings identified in Gombak, 505 buildings are of "unknown" type in the data provided. Hence, it would not be meaningful to categorize the buildings based on their type. All buildings are treated as population indicators, and the selected site should be away from the buildings.
Natural Conservation Factor (Natural Features)
The selected site should be also be away from natural features, such as forests, parks and water bodies. There are 1 forest, 4 parks and 3 water bodies identified. All of these natural features are located near the peripherals of the Gombak planning subzone. The forest is depicted with dark green on the map, while the parks and the water bodies are depicted using light green and light blue respectively.
Economic Factor (Elevation)
Lastly, the selected site should avoid steep slopes to reduce the development costs for cut-and-fill construction techniques. The lowest point in Gombak is 8 meters above sea level, depicted in light orange. The Southern region of Gombak has the highest elevation with 145 meters above sea level, depicted in dark orange. Only around 1% of the buildings and 4% of the local roads in Gombak are located in the region with the highest elevation. All natural features are located within the low-lying areas of Gombak.
Proximity Analysis on the Four Decision Factors
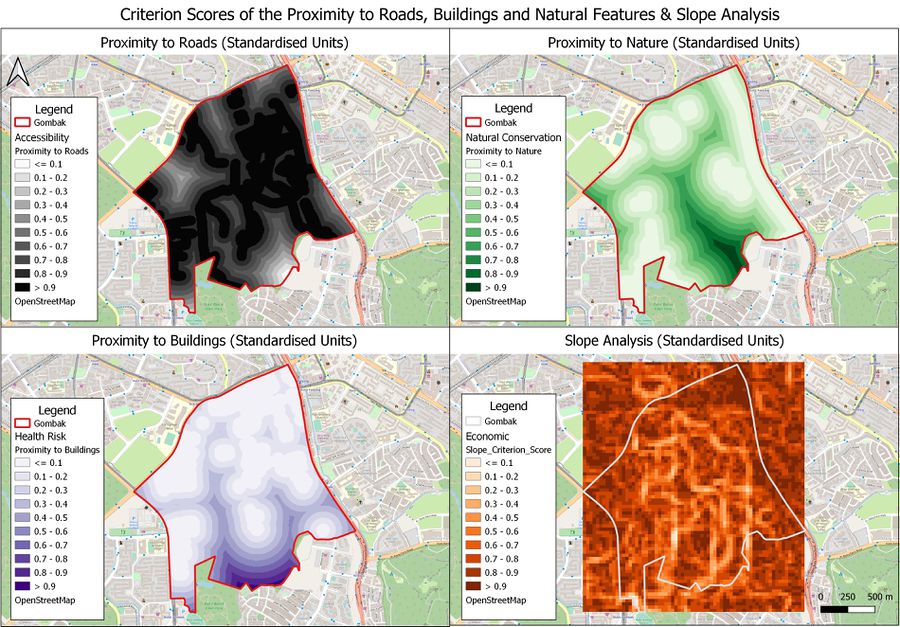
To select a suitable site, a proximity analysis is needed to show the closeness of all land lots in Gombak to the identified features of interest. In general, darker values in the maps below depict higher closeness to the features of interest, and lighter values depict lower closeness.
For the purpose of this analysis, only the features of interest located within Gombak Planning Subzone are taken into account. However, it is recognized that there are features of interest such as buildings, roads, and natural features located around Gombak but outside of the planning subzone boundaries defined by URA. This might cause the analysis results to be different to certain extent.
Proximity to Roads
Darker values depict a higher suitability of land lot in the accessibility factor. The distance from a 5 meters by 5 meters land lot to the nearest road within Gombak is 0 meters, and the furthest distance is 452.60 meters. In the map above, all land lots with distance to the nearest road of at least 200 meters are shown in white.
Proximity to Buildings
Land lots with lighter values have higher suitability to be chosen to build the quarantine center because these locations are further away from the population. The distance from a 5 meters by 5 meters land lot to the nearest building that is located within Gombak is 0 meters, and the furthest distance is 561.81 meters. All land lots with distance to the nearest building in Gombak of at least 200 meters are shown in white in the map above.
Proximity to Nature
Land lots that are further away from natural features have lighter values in the map, and they have higher suitability to be chosen to build the quarantine center. The distance from a 5 meters by 5 meters land lot to the nearest forest, park or water body is 0 meters, and the furthest distance is 517.93 meters. All land lots with distance to the nearest natural feature of at least 200 meters are shown in white in the map above.
Slope Analysis
Slopes are calculated using proximity to elevation. Land lots with darker values have flatter surfaces, and thus they have higher suitability to build the quarantine center. The minimum steepness of a 30 meters by 30 meters land lot is 0 degrees, which indicates flat land; while the maximum steepness is approximately 37.45 degrees. As seen from the map, most of the land lots in Gombak are flat, despite the rather uneven elevation in the region.
Criterion Scores on the Four Decision Factors
To calculate which plots of land are most suitable for building the National Communicable Disease Quarantine Centre, I first standardised the proximity analysis results using the following formula:
Standardised Results = [Proximity to Features - Min(Proximity to Features)] / [Max(Proximity to Features) - Min(Proximity to Features)]
After obtaining the standardised scores, I calculated the criterion scores using the following methods:
| Factors | Criterion Scores |
|---|---|
| Accessibility | 1 - Standardised Results of Proximity to Roads |
| Health Risk | Standardised Results of Proximity to Buildings |
| Natural Conservation | Standardised Results of Proximity to Nature |
| Slope | 1 - Standardised Results of Slope Analysis |
The scores range from 0 to 1, and a higher score indicates that the land lot is more suitable and more preferred within that category. In the map below, a darker colour depicts a higher score.
Accessibility Score
The accessibility score is calculated with "1 - Standardised Results of Proximity to Roads". After standardisation, the land lots that are further away from the local roads within Gombak have higher standardised units. There is a need to deduct the standardised results from 1 to obtain the criterion score for the accessibility factor as the land lots that are further away from local roads should get a lower score, and those nearer to local roads should get a higher score.
Health Risk Score
The standardised result for proximity to buildings is the criterion score for the health risk factor. Unlike calculating the accessibility score, there is no need to deduct the standardised results from 1. This is because the land lots that have lower proximity to buildings have longer distances to their nearest buildings, and after standardisation, the scores still remain high. It is also mentioned before that a further distance from buildings is more desirable as it implies that the land lot is further away from the population, which decreases the probability of disease spreading.
Natural Conservation Score
Just like calculating the health risk score, the standardised result for proximity to natural features is the criterion score for the natural conservation factor. Hence, there is no need to deduct the standardised results from 1. Further distances from natural features are preferred for this analysis. The land lots that have lower proximity to parks, forests and water bodies have longer distances to their nearest natural feature. As standardisation merely converts the results into a score with range of between 0 and 1, after standardisation, the higher scores still remain high and the lower scores still remain low.
Economic Score
The score for economic factor is calculated with "1 - Standardised Results of Slope Analysis". The land lots that have steeper slopes within Gombak have higher standardised units as they have higher degrees of steepness. Thus, the standardised results are inverted. They are deducted from 1 to obtain the criterion score for the economic factor. This is because a gentler slope is preferred in the economic factor and a steeper slope is less desired, as mentioned before.
Analytical Hierarchical Process (AHP) Input Matrix and Result Report
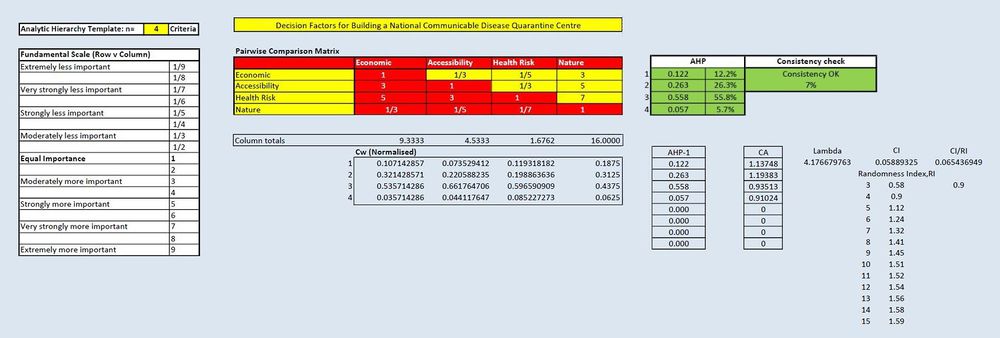
Note: The AHP report is generated using the AHP template from SCBUK and cropped to show only relevant parts of the report for neatness.
The AHP input matrix and result report is generated to calculate the relative importance of each factor. The relative importance of each factor is determined by the AHP score, as seen in the green cells in the image above. A higher AHP score translates to a higher relative importance for that factor. The input of the Pairwise Comparison Matrix is determined by the perceived importance of each factor relative to another factor. For example, as compared to accessibility factor, economic factor is moderately less important; however when compared to natural conservation factor, economic factor is moderately more important. The final results show that the most important factor is health risk (0.558), followed by accessibility (0.263) and economic factor (0.122), and lastly natural conservation factor (0.057).
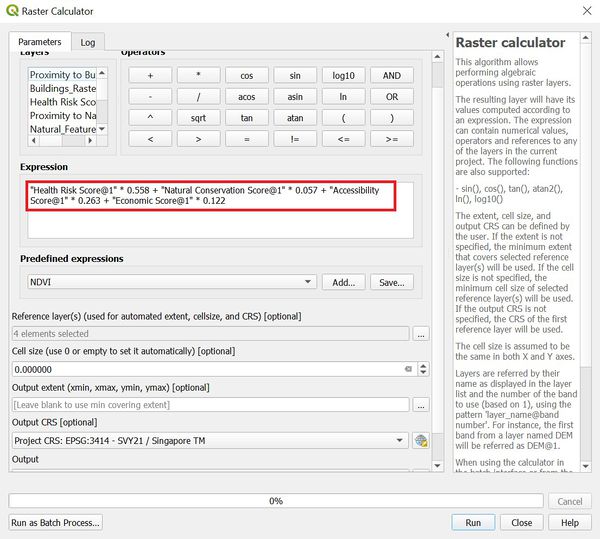
These AHP scores serve as weights to determine the final suitability score of each land lot within Gombak to build the national quarantine centre.
The consistency is at 7%, which is below 10%. This indicates that the inconsistency generated by the pairwise comparison matrix is still within the acceptable range.
Suitable Land Lots Identified
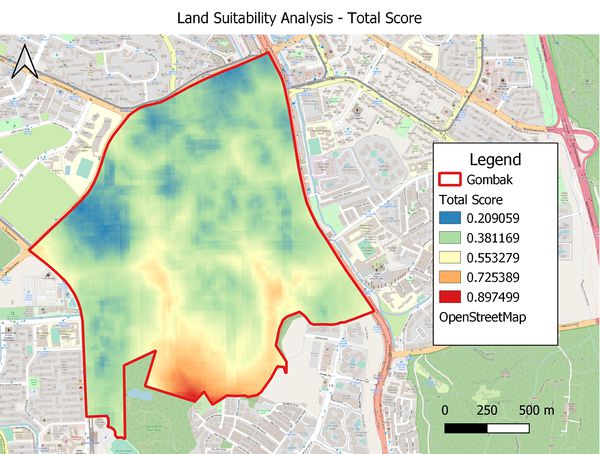
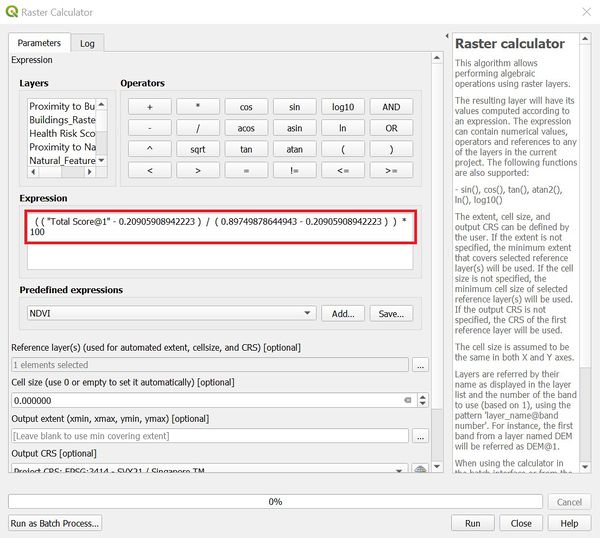
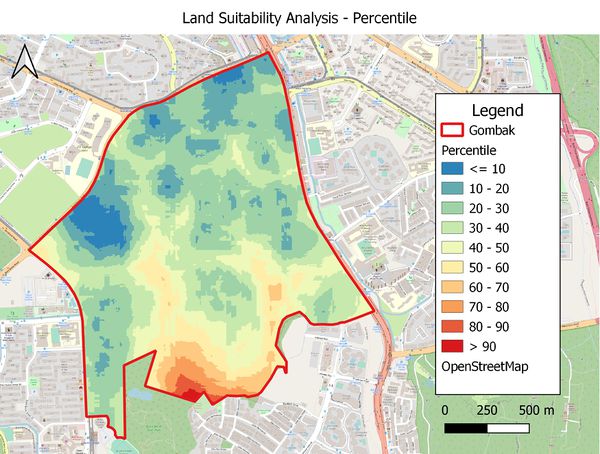
The land lot suitability is calculated using the formula shown above. However, the score wasn't intuitive enough. To get a better understanding of the scores, the percentiles are calculates using the formula shown below.
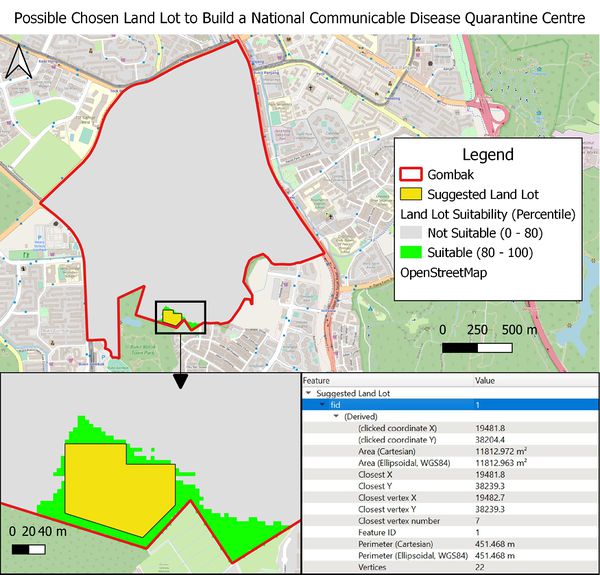
As seen from the map above, the northern part of Gombak ranked lower in terms of percentile, and is less desired to build the national quarantine centre, as compared to the southern part of Gombak. The land lots that have the highest suitability are located in the south-most region of Gombak.
For the purpose of this analysis, the land lots that are ranked above 80th percentile are deemed to be suitable. The suitable land lots, shown in green, have a total area of 19,996.92 meters square, which is larger than the stipulated contiguous area of 10,000 meters square.
As some land lots are not connected to other land lots, and the right part of the suitable land lots are only connected to the left part of the suitable land lots by a narrow stretch of land lots, it is difficult to build a quarantine centre that covers all suitable land lots that had been identified. The yellow digitised area depicts one possible plot of land that can be chosen to build the quarantine centre. The area of the suggest plot of land is 11,812.97 meters square.
