SMT201 AY2018-19T1 EX2 Pek Hui Leng Jolene
Contents
Take-home Exercise Report
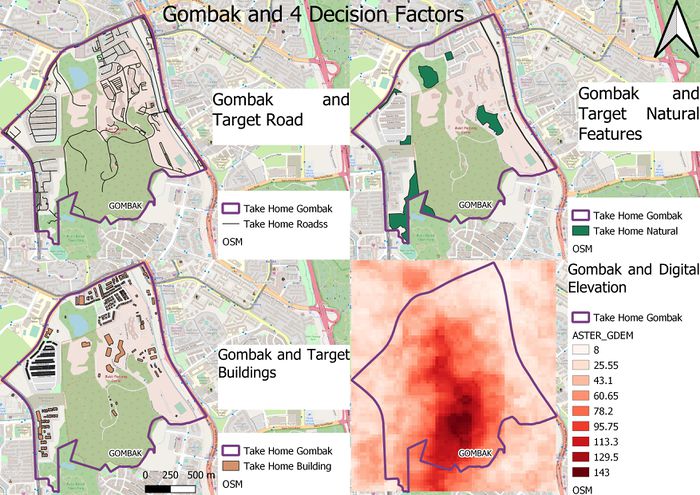
Map Layout with 4 Decision Factors
Gombak and Target Roads
The selected site should be close to existing local roads, namely: service roads and tracks. Out of the 451 roads, there are 199 service roads and 2 tracks. In general, the roads are mainly located and clustered at the North and West of Gombak.
Gombak and Buildings
The selected site should be away from population i.e. housing areas and offices in order to avoid disease spreading to the nearby population. There are 13 buildings which have "residential" as type and they are located at the South-West of Gombak. In general, the buildings are also mainly located and clustered at the North and West of Gombak, similar to the target roads.
Gombak and Target Natural Features
The selected site should be away from forested land, park and water to reduce the risk of getting further infected by any insects or unknown species in environments as such. The natural features are mainly located at the South-West, North-West and East of Gombak. Natural features in Gombak include 3 water bodies, 4 parks and one forested area.
Gombak and Digital Elevation
The selected site should avoid steep slope. The elevation ranges from 8 to 143, with the lower elevation nearer the perimeter of Gombak (except the South of Gombak), mid elevation surrounding the Central of Gombak highest elevation between the Central and South of Gombak.
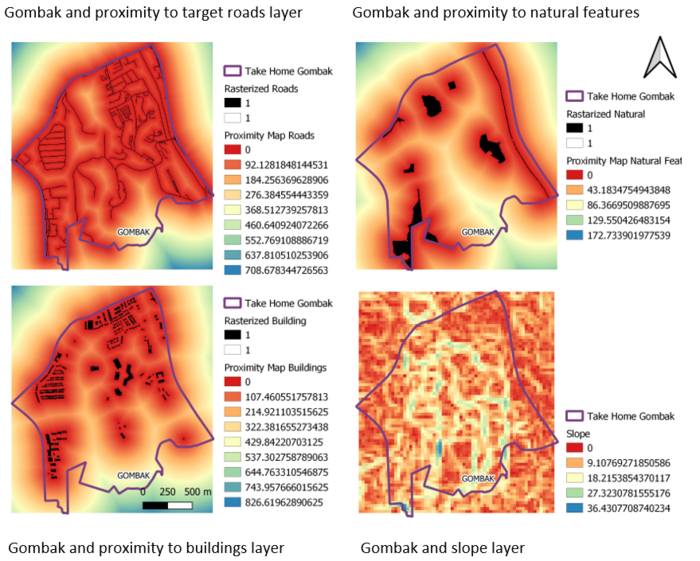
Map Layout with Proximity to 3 Decision Factors and Slope Layer
Gombak and Proximity to Target Roads Layer
The proximity from roads to a piece of 5m^2 land varies from 0 to 708.68m. As the selected sites should be closer to existing local roads, the areas in the red shaded region should be taken into consideration.
Gombak and Proximity to Buildings Layer
The proximity from buildings to a piece of 5m^2 land varies from 0 to 743.96m. As the selected site should be away from population, the green and yellow shaded regions should be taken into consideration although the blue shaded regions indicate the furthest distance from the buildings as the blue shaded regions are outside of the Gombak boundary.
Gombak and Proximity to Target Natural Features Layer
The proximity from natural features to a piece of 5m^2 land varies from 0 to 172.73m. As the selected site should be away from natural features, the green and yellow shaded regions should be taken into consideration although the blue shaded regions indicate the furthest distance from natural features as the blue shaded regions are outside of the Gombak boundary.
Gombak and Slope Layer
The slope steepness varies from 0 to 36.4 degrees. The selected site should avoid steep slope and hence the red and orange shaded regions should be taken into consideration.
Map Layout With Criterion Scores
The Min-Max Criteria Standardization Technique was used for the proximity raster layers. All standardizd criteria scores range from 0-1. The higher the criterion score (ie the greener and bluer areas on the maps), the more suitable the plot of land is for the quarantine site for each respective layer. The following standardized criteria scores are elaborated below for each layer.
Standardized Criterion Score for Road Layer
Standardized Criterion Score = 1 - (Current proximity to respective feature - 0)/(708.678344726563 - 0) As the selected site should be close to existing roads and with the initial min-max formula giving a high value for sites further away from existing roads, the standardized criterion score should be as follows so that higher criterion scores indicate a more suitable plot of land.
Standardized Criterion Score for Building Layer
Standardized Criterion Score = (Current proximity to respective feature - 0)/(826.61962890625 - 0)
Standardized Criterion Score for Natural Feature Layer
Standardized Criterion Score = (Current proximity to respective feature - 0)/(172.733901977539 - 0)
Standardized Criterion Score for Slope Layer
Standardized Criterion Score = 1 - (Current Slope of respective feature - 0)/(36.4307708740234 - 0) As the selected site should be a slope that is as gentle as possible and with the initial min-max formula giving a high value for sites at steeper slopes, the standardized criterion score should be as follows so that higher criterion scores indicate a more suitable plot of land.
AHP Matrix And Result Report
An Analytical Hierarchical Process input matrix and result report and a short description of not more than 150 words discussing the analysis results.
AHP Scoring
For example, if the economic factor is in the row and accessibility factor is in the column, the corresponding value, 3, means that the economic factor is moderately more important the accesibility factor.
AHP Pairwise Comparison
The order of importance in descending order is as follows:
Health Risk factor > Economic factor > Accessibility factor > Nature Conservation factor
The fact that a quarantined site has to be built to isolate those with diseases from the rest of the healthy population goes to show that the health risk factor whereby the selected site should be away from population in order to avoid disease spreading to the nearby population is the most important. This is to ensure least casualties as possible which could in turn reduce resources and economic spending to treat the diseases, which is why health risk factor is ranked the most important.
AHP CW (Normalised)
The values for each cell that compares 2 factors are normalised to give the above results.
AHP Scores
Using the previous normalised results, the AHP scoring are as follows:
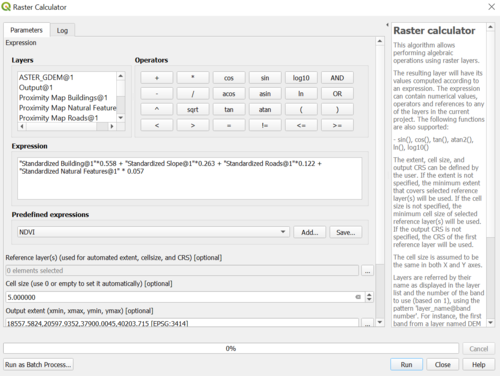
Health Risk factor: 0.558
Economic factor: 0.263
Accessibility factor: 0.122
Nature Conservation factor: 0.057
The higher the AHP score, the more important the factor is. The AHP scores will be used in the next section to determine the suitable plots of land for the quarantine centre.
The consistency check is 7% which is below 10%, showing that the AHP scoring can be used
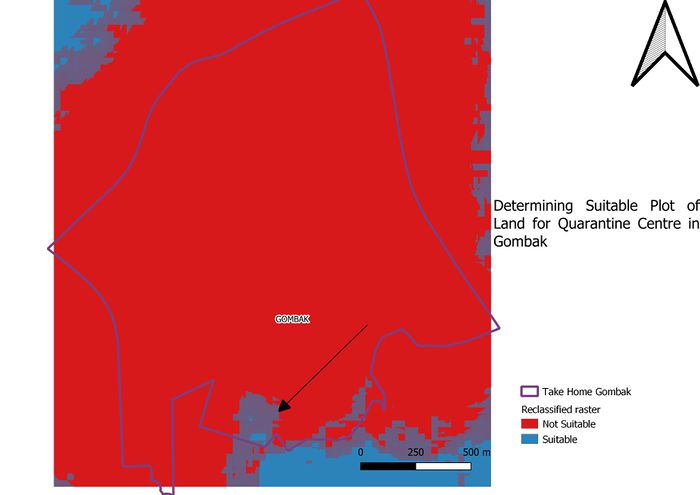
Map Layout With The Suitability Land Lot(s)
Product sum the standardized criterion scores for each layer and their corresponding AHP scores. This would allow the more important factors to play a bigger role in deciding the land suitability.
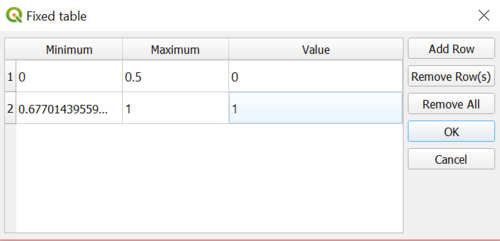
Reclassify by table was used to differentiate the lands that were unsuitable and suitable for the quarantine area using the binary model. Values above the 4th class the when classified by continuous classes were deemed as suitable for the quarantine area and labelled with a value 1.
From digitization, it was found that the plot of land the arrow is pointing to is suitable as it has a continuous area of 33615.23560727301m^2.
