SMT201 AY2019-20G2 EX2 Lek Jan Yee Lois
Contents
GIS Modelling for Urban Land Suitability Study
We are conducting a study to identify a suitable location for building a National Communicable Disease Quarantine Centre located at Gombak planning subzone. The site would need to have a contiguous area of at least 10,000m2 and meet the following criteria:
1) Economic factor: The site should avoid having steep slopes as that would require cutting and filling which would amount to a relatively higher development cost.
2) Accessibility factor: The site should be close to existing roads (service roads and tracks) for easy transportation of building materials
3) Health risk factor: The site should be away from the population as we would want to prevent the disease from spreading.
4) Natural conservation factor: The site should be away from forested land, water and parks.
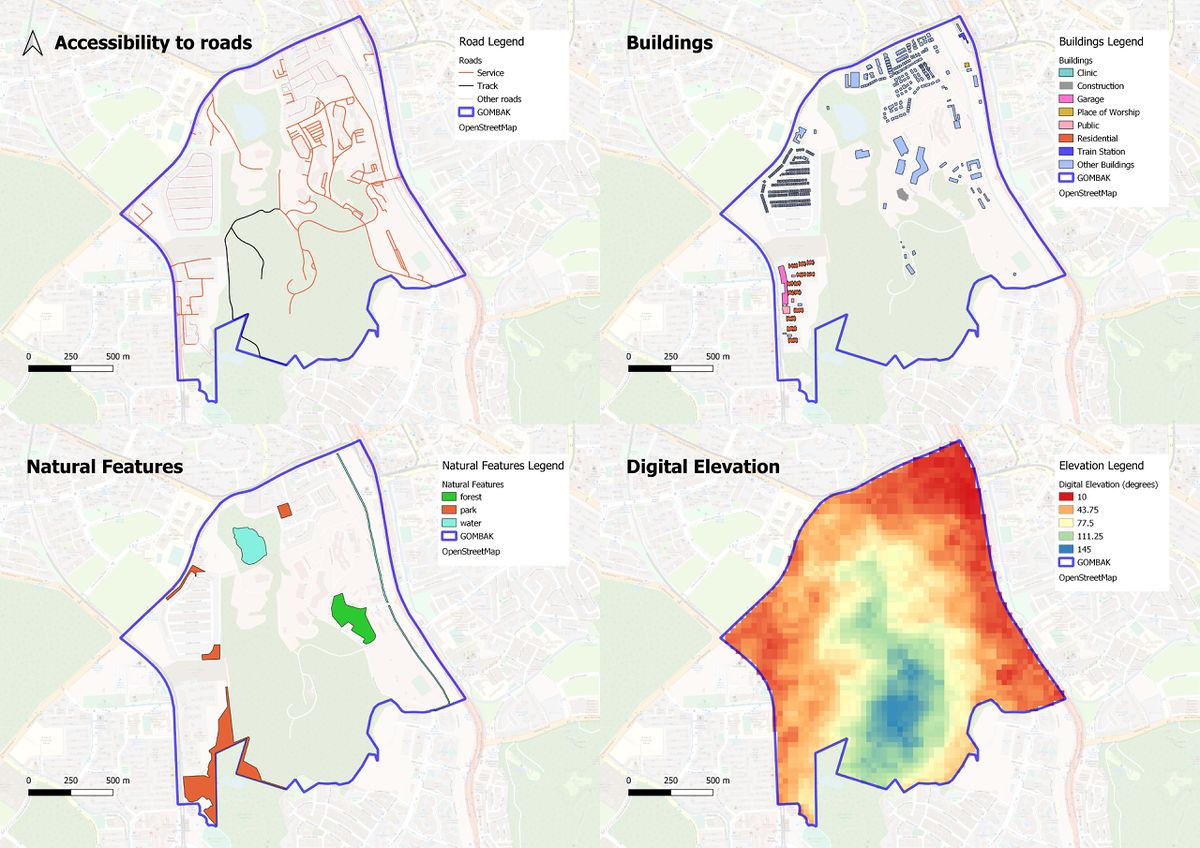
Part 1: Map View with Study Area, Target Roads, Buildings, Natural Features, Digital Elevation
The data for this analysis was obtained from the Master Plan 2014 Subzone Boundary, BBBike Singapore (buildings, roads, nature) and ASTER Global Digital Elevation Model (Elevation raster layer).
| Layer | Description |
|---|---|
| Accessibility to Roads | The figure shows the map of the Gombak location. The results are filtered to show only service roads and tracks as other data included in the roads data taken from BBBike also includes other data such as cycling routes which would not be very useful in our analysis as we are looking at the most accessible location for the transportation of building materials during the construction stage. The other routes like cycling roads were classified under Other roads for reference. |
| Buildings | Data for the building layer was taken from BBBike. Based on the map, a suitable location for the quarantine centre could possibly be in the south of Gombak but away from the Hillview residential area. This is because the centre would need to be away from the population to prevent the spread of these diseases. There are also residential areas on the east side and therefore we would want to keep the centre away from that area. |
| Natural Features | The quarantine centre should be away from forested land, parks and water as we would want to preserve these natural elements. Based on the map, a suitable location could be in between the south and central areas of Gombak. |
| Digital Elevation | The Digital elevation map was taken from NASA's Earth Data Search Site. The areas in red would be optimal areas for the quarantine centre give the elevation of the area while the blue areas would be undesirable as it would incur high land development costs due to cutting and filling. |
Part 2: Proximity Analysis
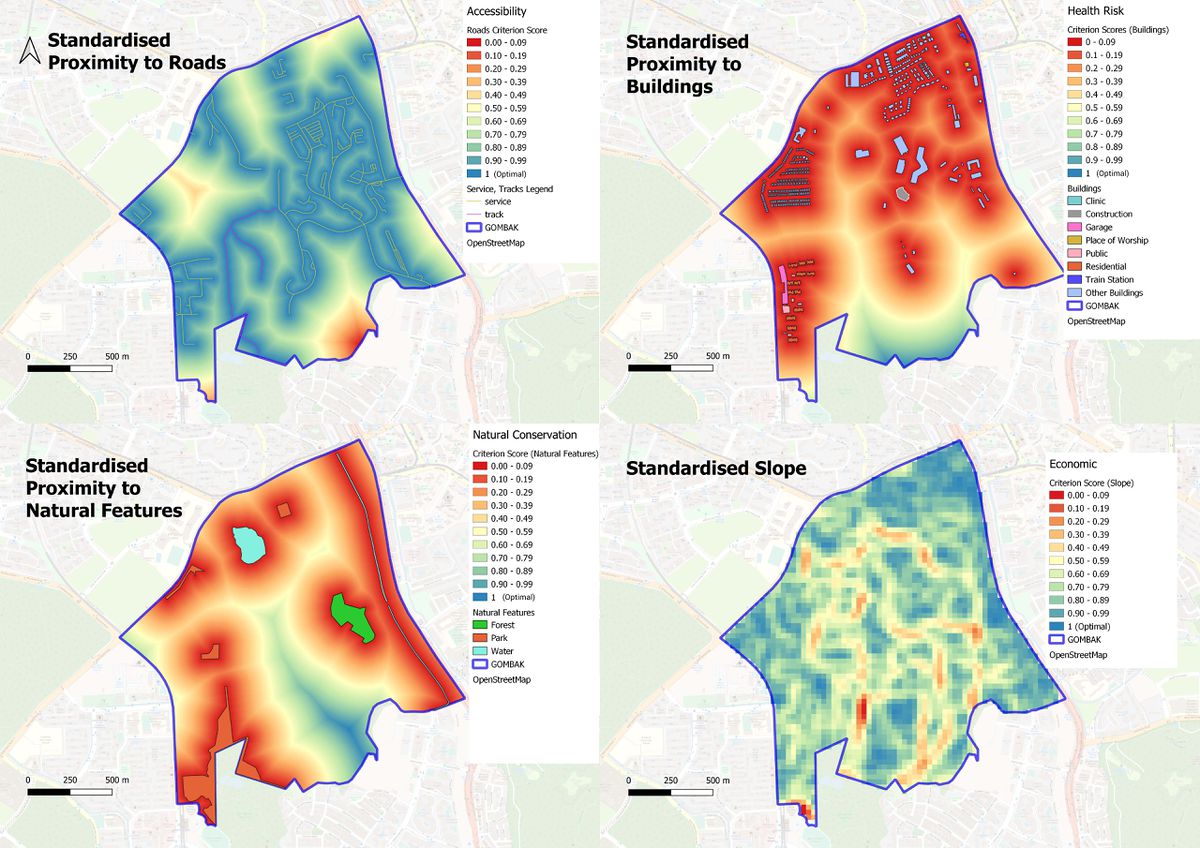
The red areas indicate areas which are undesirable while the blue area indicate areas which are desirable. For roads, buildings and natural features, I used similar distance ranges (in metres) for consistency.
| Layer | Description |
|---|---|
| Target Roads Proximity | This layer shows the proximity of the target roads to the area around it. Distances of more than 200 metres would be undesirable as it would then be difficult to transport the building materials. The most ideal location would be from 0 - 99metres. |
| Proximity to Buildings | The blue areas in proximity to buildings layer indicate the places which are desirable (more than 499 metres in distance from buildings in the area). However, one should note that there are also residential areas in the Hillview area outside of the sectioned Gombak zone which we should take into account when deciding on the optimal location. |
| Proximity to Natural Features | Example |
| Slope | Example |
Part 3: Criteria Scores
| Layer | Description |
|---|---|
| Standardised Proximity to Buildings | Example |
| Example | Example |
| Example | Example |
Part 4: Analytical Hierarchical Process
Part 5: Land Suitability
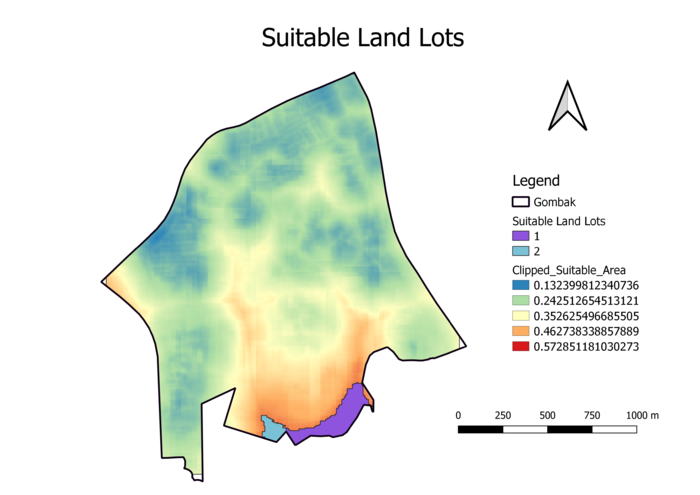
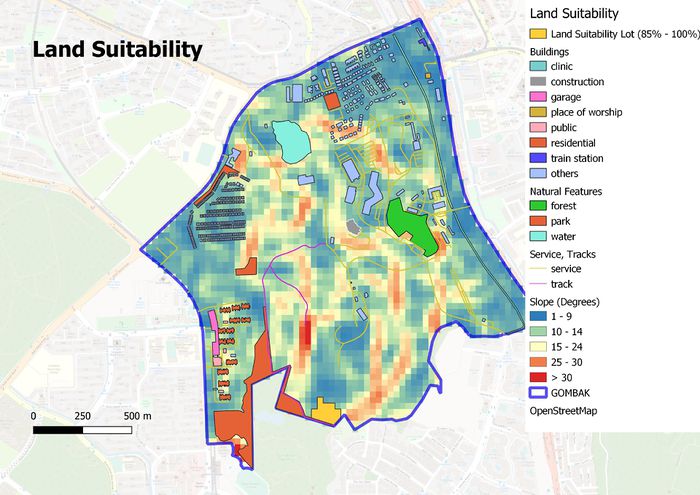
Using the standardised results from part 3, I merged all four layers together by using the raster calculator. Each factor was multiplied by its respective AHP value to give weightage.
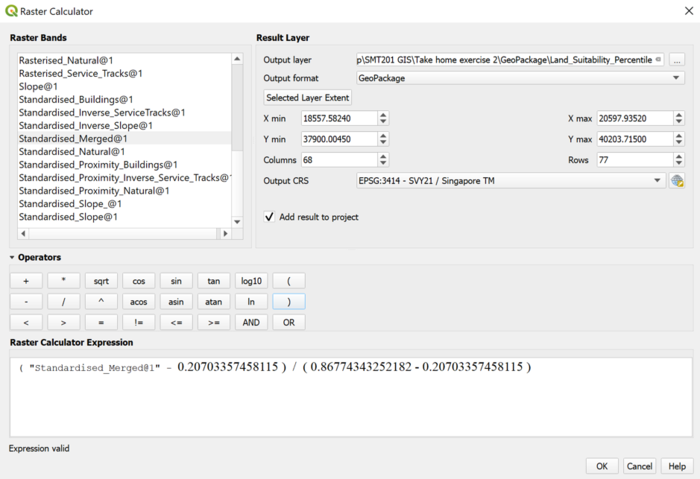
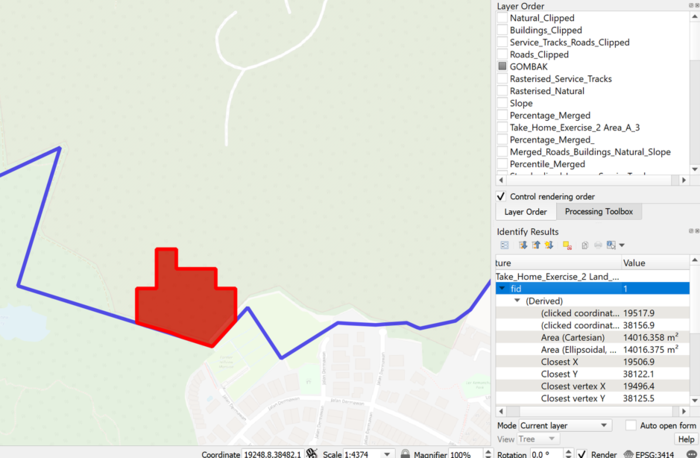
The range of results for the merged layer was from 0.207 to 0.867. To get an understanding of the optimal values, I standardised the results again and selected the region where it was more than equals to 85%.
