Ranked Proximity Map Layout
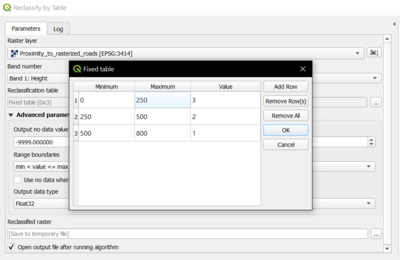
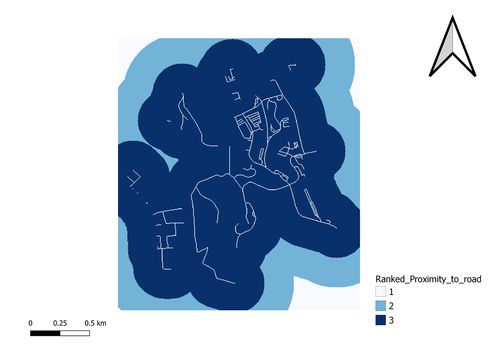
| Ranked Proximity to target roads For the accessibility factor, the location needs to be close to existing local roads, so we reclassify the table, giving the highest value for areas within 0-250 metres of the roads while giving the lowest value for areas within 500-800 metres of the roads. |
|
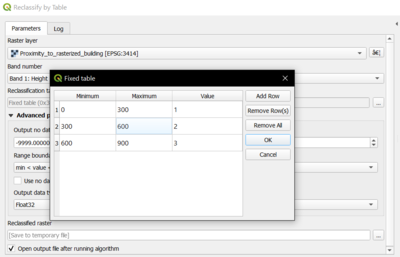
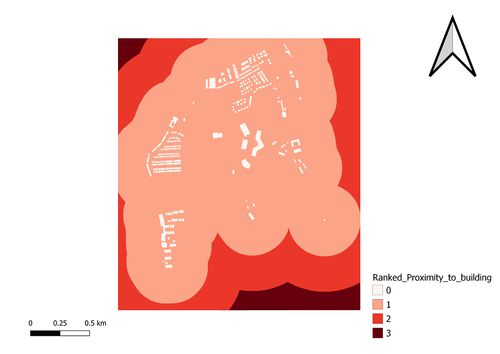
| Ranked Proximity to buildings For the health risk factor, the location needs to be far away from the population and all types of buildings to avoid the spreading of the diseases. Thus, we reclassify the table, giving the highest value for the areas, within 600-900 metres, far away from the buildings while giving the lowest value for the areas, within 0-300 metres, near the buildings. |
|
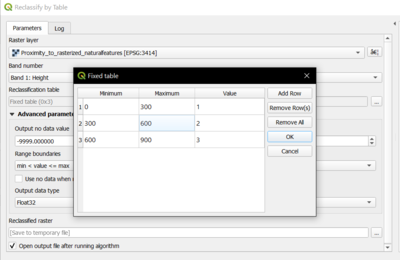
| Ranked Proximity to target natural features For the natural conservation factor, the location needs to be away from forested land, park, water and waterway so as to not contaminate the nature. Thus, we reclassify the table, giving the highest value for areas, within 600-900 metres, far away from the natural features while we give the lowest value for the areas, within 0-300 metres, near the natural features. |
|
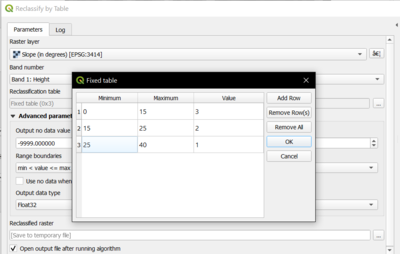
| Ranked Slope For the economic factor, the location should avoid steep slope, meaning high degrees of slope, because construction will incur higher development cost from cut-and-fill. Thus, we reclassify the table, giving the highest value for the areas with mild and least steep slope ranging from 0 to 15 degrees while giving the lowest value for the areas with the steepest slope ranging from 25 to 40 degrees. |
