SMT201 AY2019-20T1 EX2 Tan Wei Long Ryan
Contents
- 1 Project Objective
- 2 Part One : Map View with Study Area and Target Roads, Buildings, Natural Features, Digital Elevations Layer
- 3 Part Two: Proximity Map Layers
- 4 Part Three: Criterion Score of Factor Layers
- 5 Part Four: Analytical Hierarchical Process Input Matrix & Result Report
- 6 Part Five: Suitability Land Lot
- 7 References and data sources
Project Objective
In this exercise, you are tasked to identify a location suitable for building a national Communicable Disease Quarantine Centre. The selected site must be located at Gombak planning subzone, with a contiguous area of at least 10,000m2 and it must meet the following decision factors:
Economic factor [Slope/Elevation]: The selected site should avoid steep slope. This is because construction at steep slope tends to involve a lot of cut-and-fill and will lend to relatively higher development cost.
Accessibility factor [Roads]: The selected site should be close to existing local roads, namely: service roads and tracks. This is to ensure easy transportation of building materials during the construction stage.
Health risk factor [Buildings]: The selected site should be away from population i.e. housing areas and offices in order to avoid disease spreading to the nearby population.
Natural conservation factor [Natural Features]: The selected site should be away from forested land, park and water.
Part One : Map View with Study Area and Target Roads, Buildings, Natural Features, Digital Elevations Layer
In line with our project objectives, we first created a map view with the buildings, roads, natural features and elevation of our target area (Gombak planning subzone) to understand the various features there are in Gombak that will help us investigate which is the most suitable location to construct the disease centre.
Buildings: The data of all the buildings were extracted from BBBike@Singapore, from its OSM data sets, from which, the buildings in Gombak were sieved out. The buildings range from residences to commercial areas, of which all of them will contain population. As such, we have to find an area that is far away from these buildings as there is a risk that the disease from the centre might spread to the people in these areas if it is constructed in too close proximity which will be a catastrophe. We can see that towards the south of Gombak, there are lesser buildings.
Roads: The data of all the roads were extracted from BBBike@Singapore, from its OSM data sets from which, the roads (namely service roads and tracks that will aid in transportation during construction) in Gombak were sieved out. These roads were extracted by 'select features using an expression' to extract the service roads and tracks from the 'type' column. The site for the disease centre will ideally be near to these roads as it will save on transportation costs.
Natural Conservation: The data of all buildings were extracted from BBBike@Singapore, from its OSM data sets from which, the natural features in Gombak were sieved out. In Gombak, there are mainly 3 features, forests, parks and water bodies. The selected site should avoid being near forested land and parks as these areas are usually protected land. Additionally, the site should be away from water bodies as there may be a chance that the diseases can be spread into the water source, which will have dire consequences. These features seem to be far from the south-eastern part of Gombak
Elevation: The elevation data was extracted from NASA's EarthData Search Site, from its Global Digital Elevation Model (GDEM) data set. The higher the value, the higher the elevation of the location , measured in meters. This higher value would mean higher costs of construction of this disease centre as construction at steep slopes tends to involve a lot of cut-and-fill and will lend to relatively higher development cost.
Part Two: Proximity Map Layers
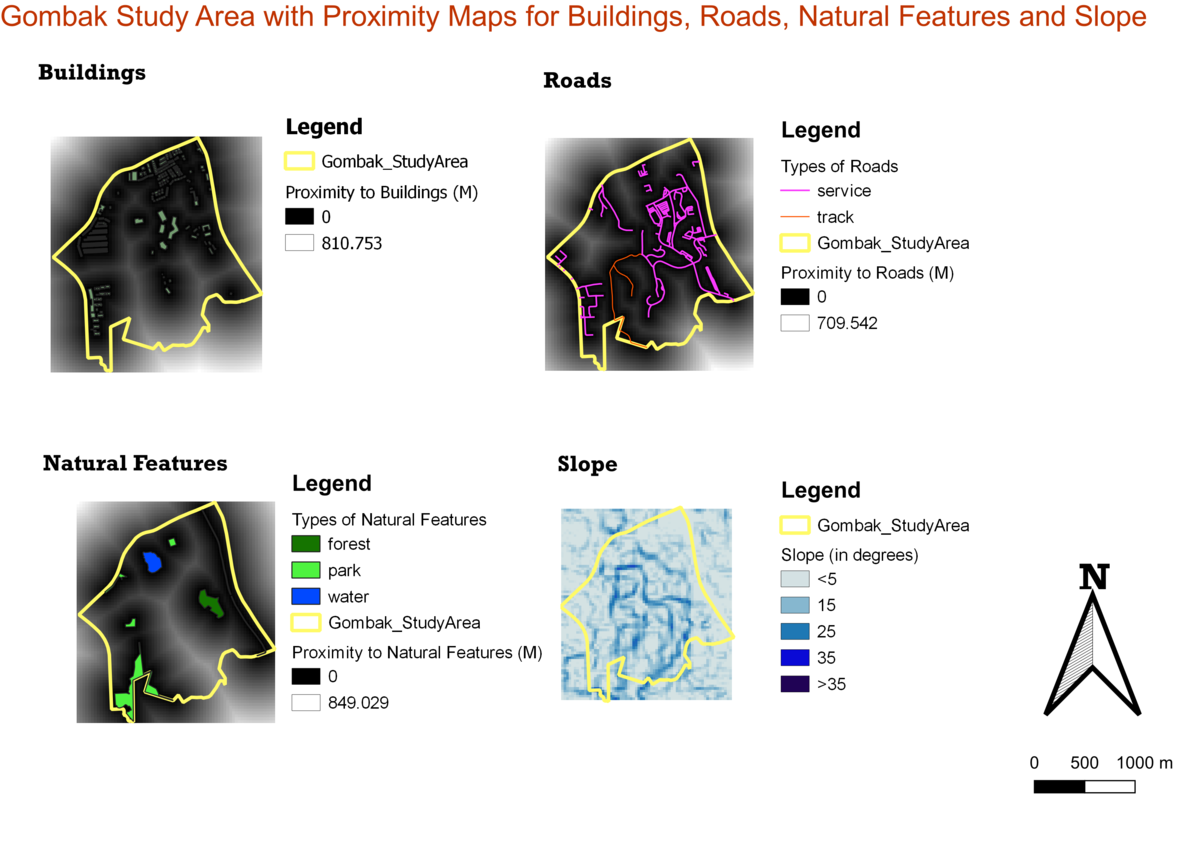
Proximity Calculation : For the proximity maps of the buildings, roads and natural features, the features were rasterised such that the proximity of the features can be calculated using the proximity function in QGIS. The slope map was obtained by performing a slope analysis on the extracted GDEM layer of Gombak
Buildings: The furthest distance from any point to a building within the Gombak study area is 810.753m whereas the closest distance to a building is 0m. The preferred location of the site is where the areas of the natural features proximity layer is closer to white, where it is far from these buildings.
Roads: The furthest distance within the Gombak study area to a road is 709.542m and the closest distance is 0m. The preferred location of the site is where the areas of the road proximity map is closer to black, where it is close to the roads.
Natural Conservation: The furthest distance within the Gombak study area to natural features is 849.029m and the closest distance is 0m. The preferred location of the site is where the areas of the natural features proximity map is closer to white, where it is far from these natural features.
Slope: The minimum and maximum of slope features within Gombak is 0 and 36.828 degrees respectively. For this layer, we applied singleband pseudocolour for easier analysis of the raster layer. The slope values were classified into 5 bands which corresponded to differing shades of blue. The lower the slope value, the lighter the shade of blue. The preferred location of the site is where the colours are a lighter shade of blue.
Part Three: Criterion Score of Factor Layers
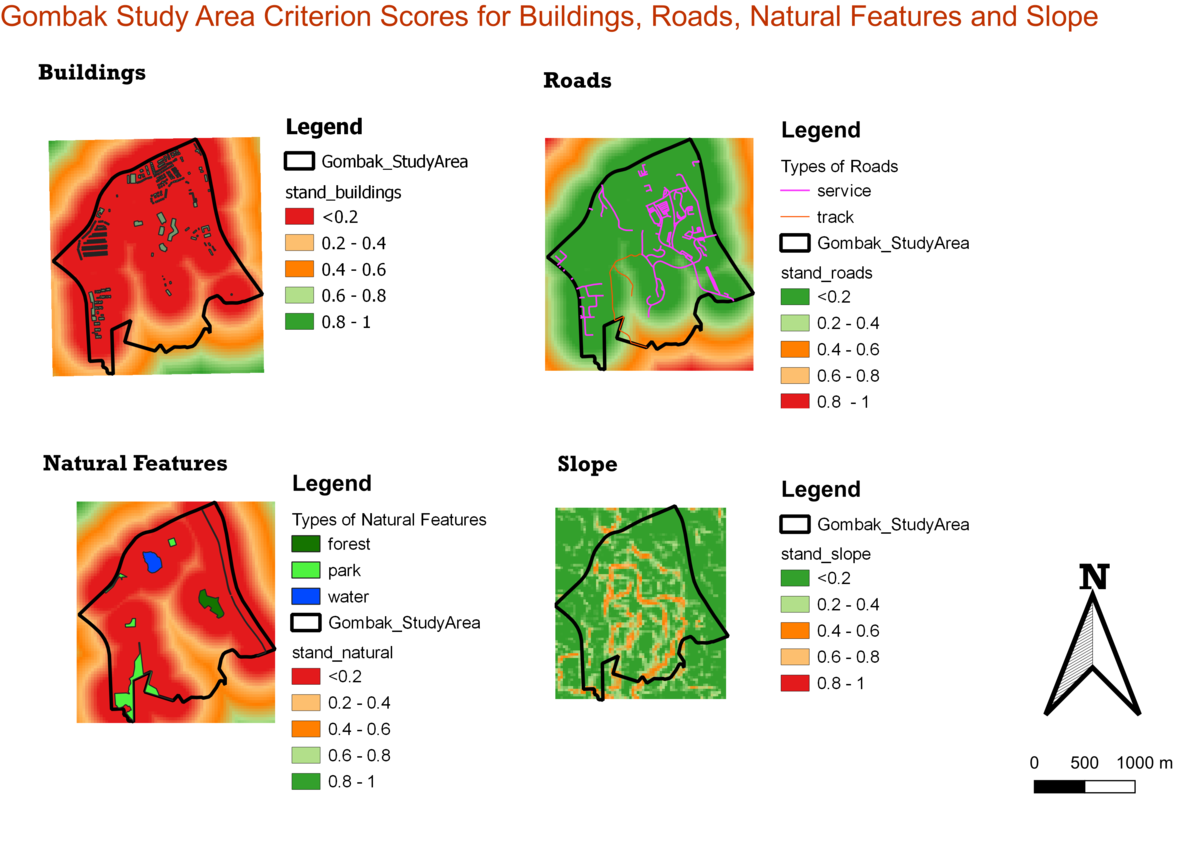
Criterion Score Calculation : We performed a standardization of all four of the map layers as they were in differing units and scale. We applied the Min-Max technique to normalize each of these layers. Next, we used a standardized approach for each of the criterion scores map. As the results of the standardization will make the scores range from 0 to 1, we classified these values into 5 bands, namely:
1. < 0.2
2. 0.2 - 0.4
3. 0.4 - 0.6
4. 0.6 - 0.8
5. 0.8 - 1
Next, we used singleband pseudocolour with a standardized approach whereby the colour of the areas in the map will range from green to red. The green areas are areas that will be more ideal to have the construction of the disease centre while the orange areas are still acceptable and red is least ideal.
Buildings: As being further away from a building is better in this context, the colour of the 5 bands ranged from red to green whereby having a lower score upon 1 will be assigned the red colour, while having the highest being assigned green. We can see that taking only the health risk factor into account, which is shown by the criterion score of the buildings layer, the ideal site for constructing the disease centre will be at the south of Gombak.
Roads: As being nearer to the roads is better in this context, the colour of the 5 bands ranged from green to red whereby having a lower score upon 1 will be assigned the green colour, while having the highest being assigned red as a lower score here means that the area is closer to the targeted roads. We can see that taking only the accessibility into account, which is shown by the criterion score of the roads layer, we can see that within the whole of Gombak planning subzone, it is mostly accessible as seen by the large spread of green colour across the planning subzone. The southern part of Gombak fared worse than the other regions as seen from the orange and lighter shade of green.
Natural Conservation: As being further away from a natural feature is better in this context, the colour of the 5 bands ranged from red to green whereby having a lower score upon 1 will be assigned the red colour, while having the highest being assigned green. We can see that taking only the natural conservation factor into account, which is shown by the criterion score of the natural features layer, the ideal site for constructing the disease centre will be at the south-east of Gombak as shown by the beige and orange colours compared to the red of the rest of the areas within Gombak.
Slope: As having a lower slope value is better in this context, the colour of the 5 bands ranged from green to red whereby having a lower score upon 1 will be assigned the green colour, while having the highest being assigned red as a lower score will mean a lower slope, which is better for construction of the disease centre. We can see that taking only the economic cost factor into account, which is shown by the criterion score of the slope layer, the overall area of Gombak is quite suitable for construction of the disease centre as it is mostly green with some orange parts in Gombak.
Part Four: Analytical Hierarchical Process Input Matrix & Result Report
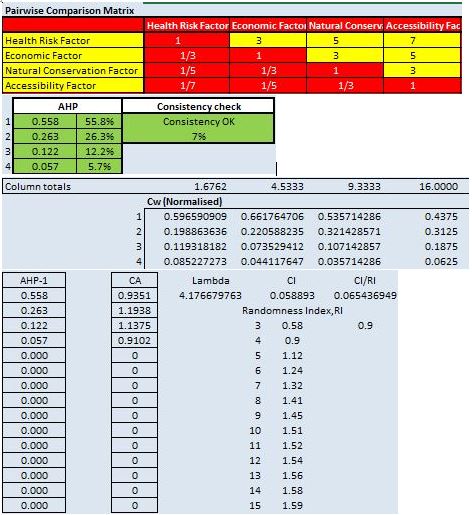
For the Analytical Hierarchical Process (AHP) input matrix, the order of importance in terms of the four variables are: (refer to pairwise comparison matrix for relative importance of each factor)
Health Risk (Most Important)
Economic
Natural Conservation
Accessibility (Least Important)
The health risk factor was deemed as to be the most important factor. The nature of the fact that it is a quarantine site for communicable diseases makes it of utmost importance that the site is isolated from the population so that the spread of the diseases is minimized.
Contemplating between the other factors, economic factor ranked second as cost is often a huge factor in all projects, and it is best to keep it at minimum so that the project can be completed within budget. Additionally, the inaccessibility of the roads to the site could be resolved by using more money for alternative forms of transportation.
To decide between the least importance factor, accessibility was chosen as it could be minimized by having more budget, and the natural conservation factor is more important as there are regulations set in place for protecting these land and might pose difficulty in getting approval to start the project
With the input of importance of these factors, we calculated the AHP scores which determines the weight of the factor and achieved a consistency result of 7% (ok).


