SMT201 AY2019-20G2 Ex2 FOO CHUAN GENG
Contents
Scope
The purpose of the project is to derive area in Gombak subzone to contain the Communicable Disease Quarantine Centre
There are a few factors to take note while deciding the suitable site:
- Economic factor: The selected site should avoid steep slope. This is because construction at steep slope tends to involve a lot of cut-and-fill and will lend to relatively higher development cost.
- Accessibility factor: The selected site should be close to existing local roads, namely: service roads and tracks. This is to ensure easy transportation of building materials during the construction stage.
- Health risk factor: The selected site should be away from population i.e. housing areas and offices in order to avoid disease spreading to the nearby population.
- Natural conservation factor: The selected site should be away from forested land, park and water.
Map Layout
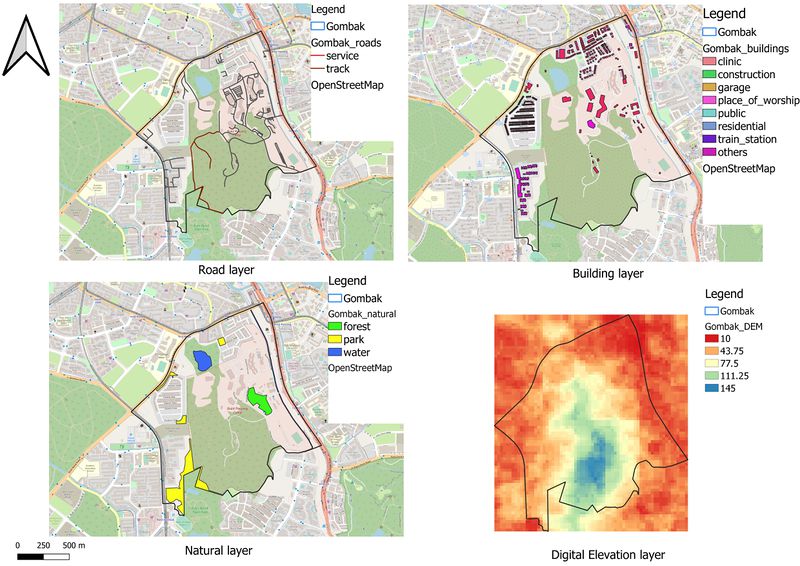
- Road layer - We filtered the shape file to service and track roads only as it is stated in the requirement.
- Building layer - The priority consideration will be the public health, therefore the site should be far away from the building as possible.
- Natural layer - There is park, forest and especially water bodies, which we need to take note of when planning the suitable site
- Digital elevation model - From red to blue, it represent the degree of slope in increasing order.
Map layout (Proximity)
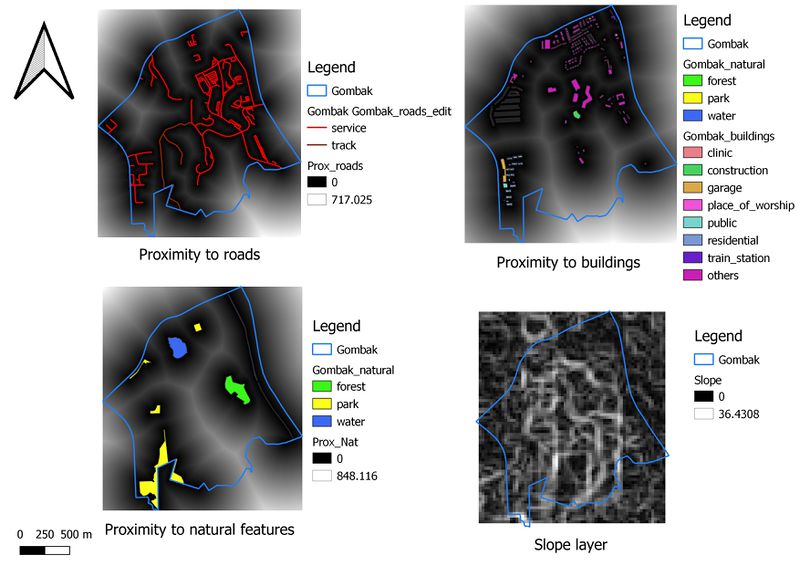
- Roads - The longest distance to the road is 7171.025 meters, for this project, the site should be in a distance <= 200 meters to have better accessibility during construction so that the facility can be built faster.
- Building - The longest distance to the building is 816.364, the location of the site should be >= 250 meters away from the buildings as population resides / have interaction over there.
- Natural features - The longest distance to the natural features is , as 848.116 meters, due to conservation, site location should also be >=250 meters away from the features
- Slope - The steepest slope is 36.4308 degrees, site should be <=15 degree as developers do not want to incur cost by building in a ore steeper location.
Map layout (Criterion scores)
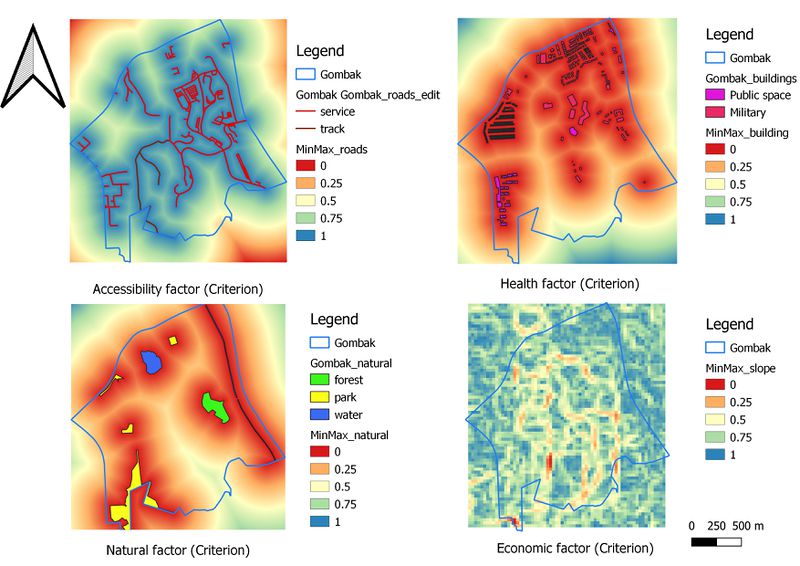
We normalize (using the min - max method) by though raster calculator, using values from the proximity layer as the values are far apart from each other (e.g. degree (slope) vs metre (road,building,natural features)
Moreover, we want to ensure that there is no disparity when it comes to given weightage by the AHP later on
We wanted to have 1 - (normalize value) of slope and road, as we want the proximity layer to give lower distance a high value (As we wanted the facility to be closer to the roads)
And for slope, a lesser degree a high value. (As we wanted the facility to be built on less steep grounds)
Equation goes like this :
- Road (Criterion score) - 1- (("Prox_roads@1" - 0) / (717.0250854492188 - 0))
- Building (Criterion score) - ("Prox_Building@1" - 0) / (816.3638916015625 - 0)
- Natural (Criterion score) - ("Prox_Nat@1" - 0) / (848.1155395507812 - 0)
- Slope (Criterion score) - 1 - (("Slope@1" - 0) / (36.43077087402344 -0))
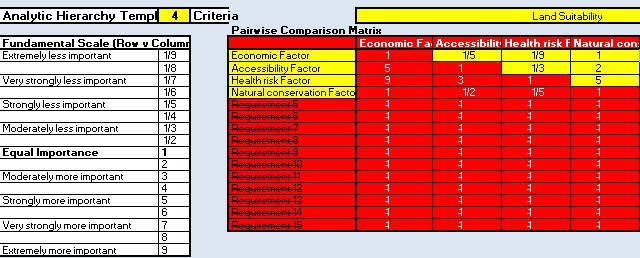
Analytical Hierarchical Process input matrix
Result and analysis report =
- 1. Economic factor (7.1%) - We decided to make this the least priority as the entire Gombak area is almost full of steep slope, we feel it will limit the choice of having a suitable site if this is given a highest priority.
- 2. Accessibility factor (23.8%) - We decided to make this the second highest weightage as construction can be done fast by having nearby infrastructure (roads) that is ready to use.
- 3. Health risk factor (59.1%) - We decided to give this the most weightage as we feel that public safety is the most important.
- 4. Natural conservation factor (10.0%) - We decided to make this the 3rd priority as we feel that after the suitable sites are generated, there can be other measures to put in place to mitigate environmental damage or we can choose other suitable location.
Suitability Land Lot Map Layout
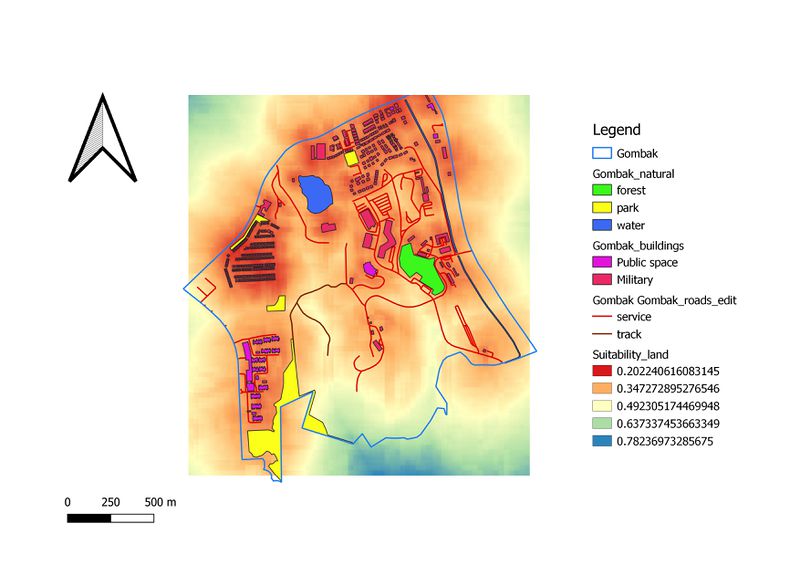
From the AHP percentage, we used raster calculator to calculate the land suitability layer :
("MinMax_building@1"*0.591) + ("MinMax_natural@1"*0.100) + ("MinMax_roads@1"*0.238) + ("MinMax_slope@1"*0.071)
The area that are in light green / blue are areas where it is suitable to contain the CDQC
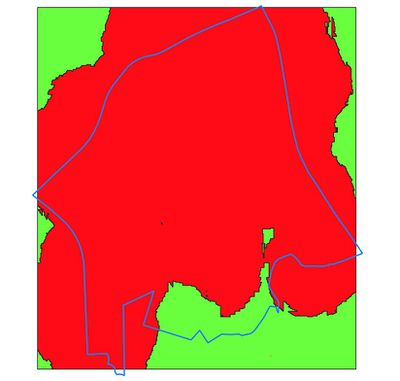
The area that are in light green / blue undergo a raster --> vector conversion, where the green areas represent suitable locations, however we still need to filter the area according to Gombak subzone
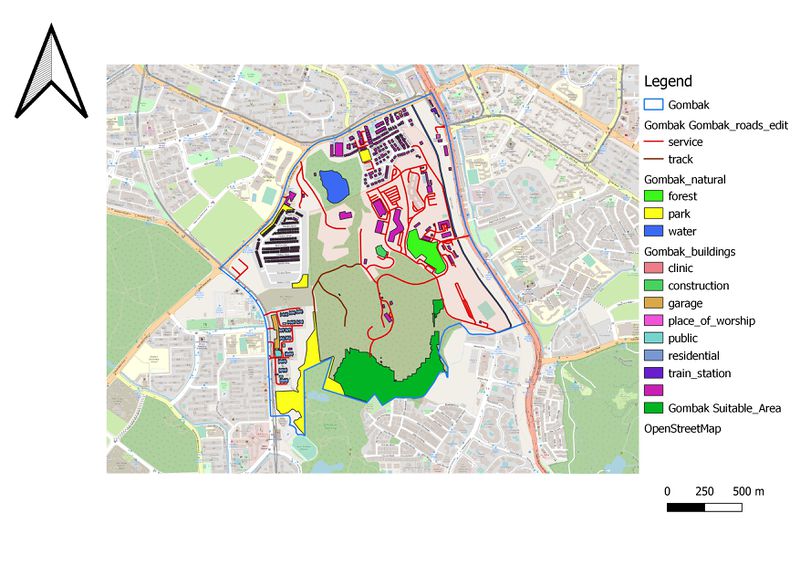
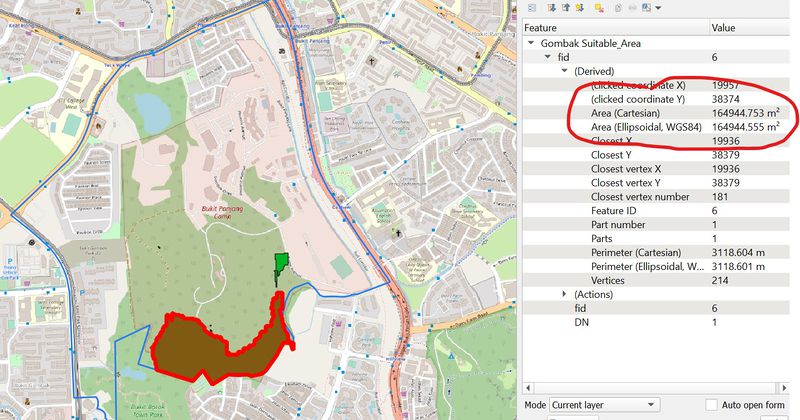
So after clipping is done, The suitable land lot (green area) identified holds an area of 164944.753 m2, which is above the requirement of 10,000 m2.
The developer of the CDQC can choose to use the area in any specification that they want
While it is away from the population and most of the natural features, one issue of the identified plot is that it is near a park (shape denote by the color yellow) , developers of CDQC should choose to move away from the area a little or put in place measures to prevent environmental / health damage (as people may visit the park).
This is where we also realise that even though building is under the health factor, parks should be accounted too under health factor, as the public visit the park.
All data Source:
