SMT201 AY2019-20T1 EX2 Tan Jie Ting Christine Criterion
|
Criterion Scores |
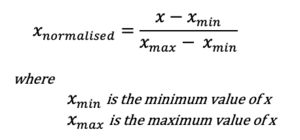
For all the views, I performed Normalisation to get the criterion scores to be between 0 and 1. This is done to ensure that the factors all have a common scale and the factors will have the same range. This makes it easier to compare the different features. The formula of normalisation is as follows:
For all the factors, having a higher score (where the maximum score attainable is 1) is the most favourable, and conversely, having a lower score (where the minimum score attainable is 0) is the least favourable.
Contents
Maps
Criterion Scores for Target Roads Layer
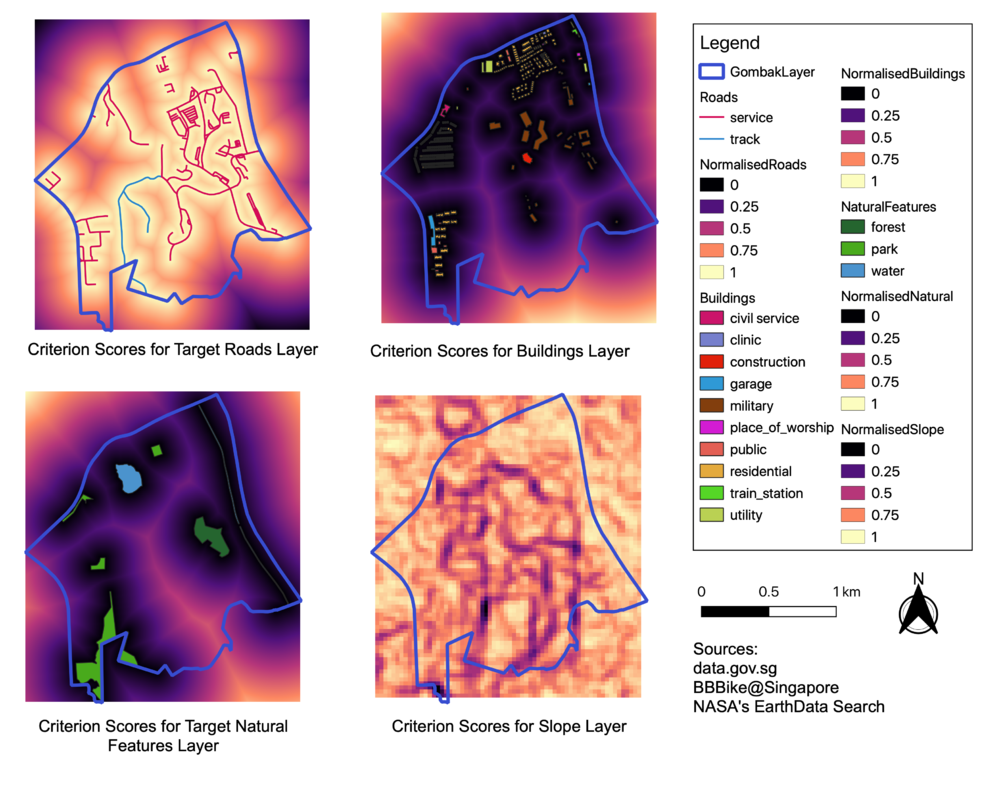
As mentioned earlier, we would want to choose an area with higher proximity to local roads. The areas near the roads have higher proximity and hence, will have a higher score. As we have concluded from the previous proximity map that most of Gombak area are in close proximity to local roads, we can see that most of Gombak area is light yellow, with the score of 1, the highest attainable score.
Criterion Scores for Buildings Layer
Unlike the target roads layer, we want to choose an area with lesser proximity to buildings to lower the health risk of the rest of the population. As we have concluded from the previous proximity map that most of Gombak are in close proximity to buildings, most of Gombak area is black, with the score of 0, the lowest attainable score.
Criterion Scores for Natural Features Layer
As previously identified in the proximity layer, only a thin strip from the centre of Gombak down to the south are not in close proximity to a natural feature. Similarly, we see in the third view of the above map that this thin strip has been assigned a score of about 0.5, and the rest of the areas of Gombak, a score of 0.25 and below.
Criterion Scores for Slope
As we want to choose an area that is flat, the areas that have been identified to be steep have been given a lower score of 0.25 and below, as seen in the purple and black areas in the fourth view in the map above. Fortunately, most areas are orange and yellow in colour, showing that they have a high score of 0.75 and above.

