SMT201 AY2019-20T1 EX2 Tan Jie Ting Christine AHP
|
AHP |
AHP
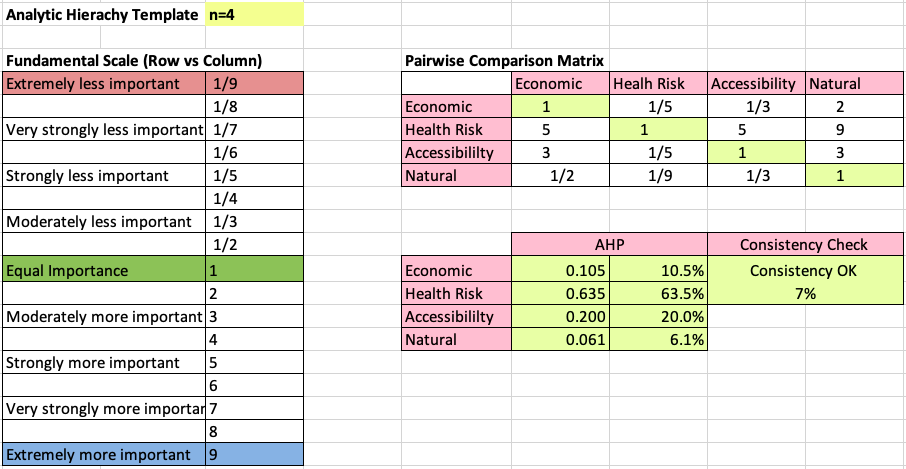
For the next step of our analysis, we perform analytic hierarchy process (AHP) to rank the importance of the factors and assign weights to them before we calculate the final scores.
For their level of importance, I ranked the factors in this order:
- Health Risk (Far from buildings)
- Accessibility (Close proximity to local roads)
- Economic (Land should be as flat as possible)
- Natural Conservation (Far from natural features)
I ranked health risk with the highest importance because it potentially can lead to the largest scale impact. If the site were to be built close to buildings, where people frequent, the chances of them getting sick would be high, which would be extremely costly for medicine, productivity, etc. Accessibility comes in second because supplies like medicine are crucial at a communicable disease centre, and hence ease of transportation of these supplies is important. Also, time is of essence to bring a person who is sick to be quarantined, thus having the site near local roads is important. As for the economic factor, I rank it as relatively high importance because the additional costs to construct the site on a slope could be spent more effectively elsewhere, such as medicine for the patients. It is however, of a lower ranking than the first two factors because the economic factor incurs a one-time payment in the short-term, unlike the other two which will have long-term consequences. The natural conservation factor was then ranked the last because the impact of the site being close to nature is negligible compared to the other factors.
After ranking the factors, I adjusted the variables in the pairwise comparison matrix, keeping the ranking as above, until the consistency is less than 10%, which led to the conclusion as in the figure above.
