SMT201 AY2019-20T1 EX2 Tan Jie Ting Christine Proximity
|
Proximity |
Contents
Maps
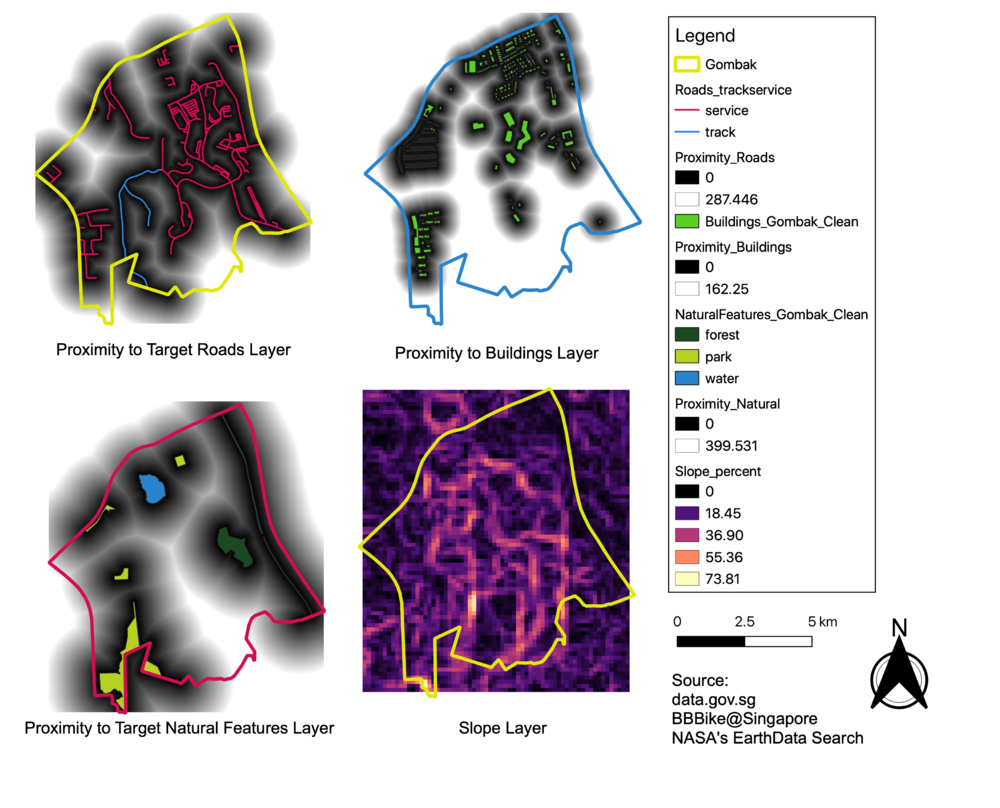
Proximity to Target Roads Layer
In the first view, most areas in Gombak are in shades of black, showing that most of Gombak are in close proximity to a local road.
Proximity to Buildings Layer
In the second view, we can see that there are black areas populating most of Gombak, except for the southern area. From here, we can see that if we were to consider only the health risk factor, we would pick an area in the south of Gombak.
Proximity to Target Natural Features Layer
In the third view, we can see there is a strip of white from the centre of Gombak down to the south. Those areas are the only areas in Gombak that are in far proximity from a natural feature.
Slope Layer
In the last view, I used the slope tool in QGIS to get the raster slope layer, measured in terms of percentage of steepness. The higher the percentage, the more steep the area. Most areas have a steepness of less than 36.90%, with a small exception of the area being 73.81%. Amongst the area that are less than 36.90%, a significant number are flat, or around 20%.
