SMT201 AY2019-20G1 Ex2 Kning Kit Siang
GIS Modelling for Urban Land Suitability Study
Contents
- 1 Target Roads, Buildings, Target Natural Features and Digital Elevation of Study Area (Gombak)
- 2 Proximity to Target Roads, Buildings and Natural Features with Slope Layer of Study Area (Gombak)
- 3 Criterion Scores of each factor layers
- 4 Analytical Hierarchical Process Input Matrix and Result Report
- 5 Suitability Land Lot(s)
- 6 Methods of Computation
Target Roads, Buildings, Target Natural Features and Digital Elevation of Study Area (Gombak)
Service Roads and Tracks in Gombak
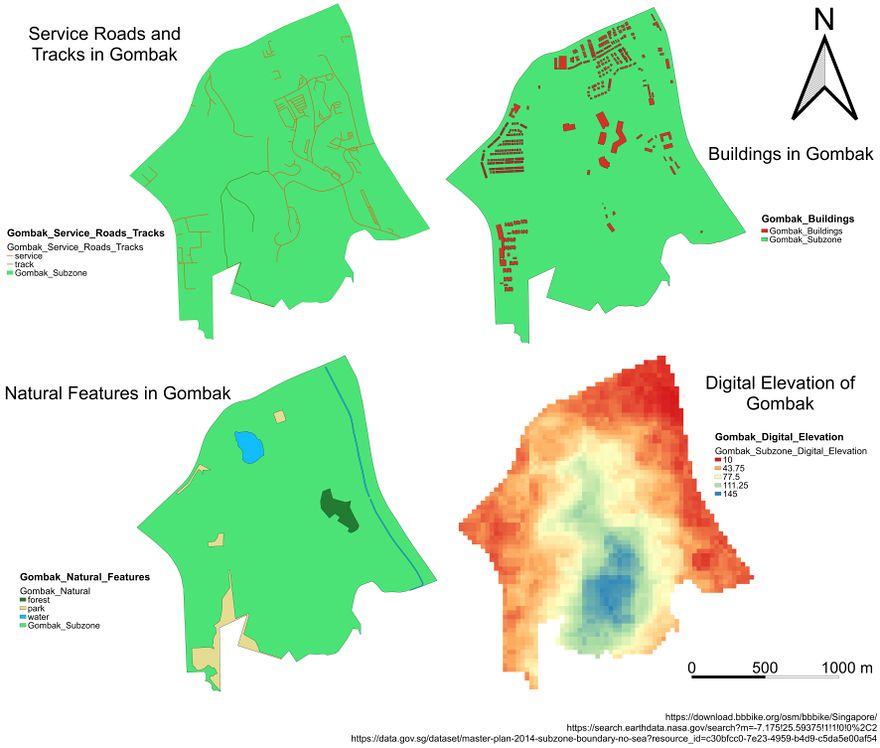
The view for service roads and tracks in Gombak shows the structure and location of the areas where the service roads and tracks are built in Gombak. As the accessibility factor only requires roads which are suitable to be utilised during the construction phase, only the service roads and tracks are chosen. The service roads are labelled with orange while the tracks are labelled with dark green to help in differentiating the two types of roads.
Buildings in Gombak
The view for buildings in Gombak shows the location of each building which are built within the Gombak subzone. The buildings in Gombak are not categorised because all buildings within the Gombak subzone is important to be considered for the health risk factor.
Natural Features in Gombak
The view for natural features in Gombak shows the location of the natural features which can be found within the Gombak subzone. There are three types of natural features found in Gombak; forest, park and water. As there are three types of natural features in Gombak, these natural features are categorised and labelled with different colours for better visualisation. In Gombak, there is a significant area of park and a few regions which contain water. There is also a small region near the centre of Gombak which is covered with forest.
Digital Elevation of Gombak
The view for digital elevation of Gombak shows the different level of elevation in different regions within the Gombak subzone. The centre of Gombak has the highest level of elevation compared to the other regions in Gombak. The level of elevation in Gombak is observed to be decreasing as it diverges from the centre of Gombak to the north region. The regions furthest from the centre of Gombak are observed to have the lowest level of elevation.
Proximity to Target Roads, Buildings and Natural Features with Slope Layer of Study Area (Gombak)
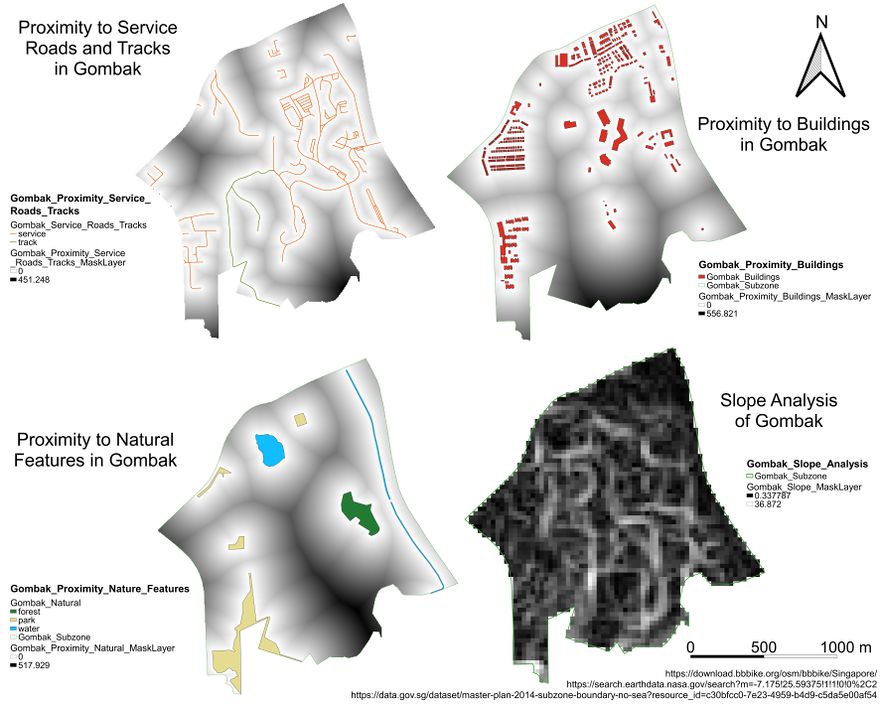
To determine the proximity to each of the three features, road services and tracks, buildings and natural features, the proximity analysis tool by GDAL has been used. Furthermore, to determine the slope within the Gombak subzone, the slope analysis tool by GDAL has been used.
Proximity to Service Roads and Tracks in Gombak
The view for proximity to service roads and tracks in Gombak shows how near different areas in Gombak are from the service roads as well as tracks. Areas with minimum proximity to the service roads and tracks (proximity of 0) are labelled in white while areas with maximum proximity to the service roads and tracks (proximity of 451.248) are labelled in black.
Proximity to Buildings in Gombak
The view for proximity to buildings in Gombak shows how near different areas in Gombak are from the buildings within the Gombak subzone. As most of the buildings in Gombak are built in the north region, the areas in the south region have the furthest proximity to buildings with the maximum being 556.821. Therefore, the areas in the south region would be more suitable to be considered while selecting the suitable land lot(s). Proximity to buildings which is nearer is observed around the north region and the south-west region of Gombak.
Proximity to Natural Features in Gombak
The view for proximity to natural features in Gombak shows how near different areas in Gombak are from the natural features found within the Gombak subzone. Proximity to natural features which is nearer is observed around the east region and the south-west region due to the presence of water and park within two regions. The area from centre of Gombak to the south-east of Gombak has the furthest proximity to the natural features with the maximum being 517.929. This area would be suitable to be considered while selecting the suitable land lot(s).
Slope Analysis of Gombak
The view for slope analysis of Gombak shows the different steepness of slope within the Gombak subzone. The areas which have steeper slope are labelled in white, with the maximum being 36.872, and are not suitable to be considered while selecting the suitable land lot(s). The areas with slope that is less steep are more concentrated around the far north region as well as some small areas which are around the centre, far east region, far south region and far west region of Gombak. These areas are more suitable to be taken into consideration as less steep slope would avoid high costs being incurred.
Criterion Scores of each factor layers
Analytical Hierarchical Process Input Matrix and Result Report
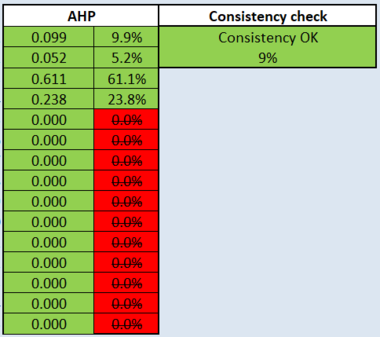
In order to determine the relative importance of each factor, the comparison is carried out by row in order to determine the suitable level of importance of one factor compared to another factor. For example, the ‘Economic’ factor is given a 3 when compared with the ‘Accessibility’ factor. This means that ‘Economic’ factor is moderately more important than ‘Accessibility’ factor.
After the respective scores have been allocated within the input matrix for each factor, the final AHP score for each factor is calculated through normalisation of the respective scores within the input matrix and summation of the scores by row. As the AHP score for health risk factor is the highest (0.611), this means that health risk is the most important factor to be considered. While accessibility factor has the lowest AHP score, it is the least important factor to be considered. Furthermore, the consistency of the matrix is 9%, which means the total score of each factor are within the consistent within the same scale.
Suitability Land Lot(s)
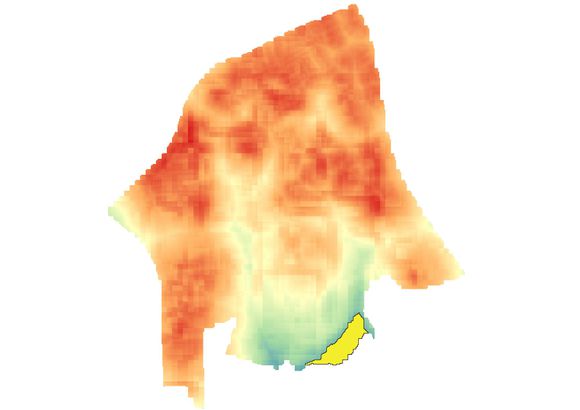
The map layout above shows the standardised total score when every standardised factor layer is summed together. The areas which are less suitable to be considered for the selection of land lots would be in red and have the lowest score (0) while the areas which are more suitable would be in blue and have the highest score (0.57772).
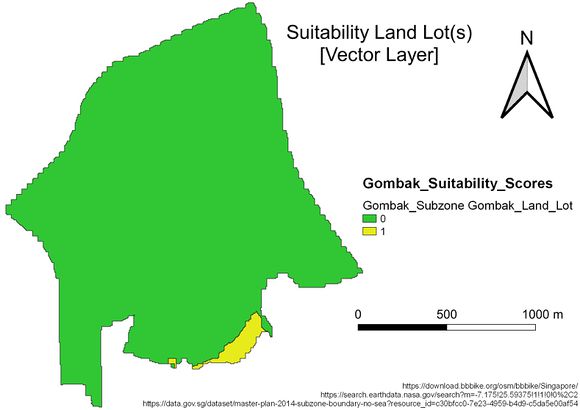
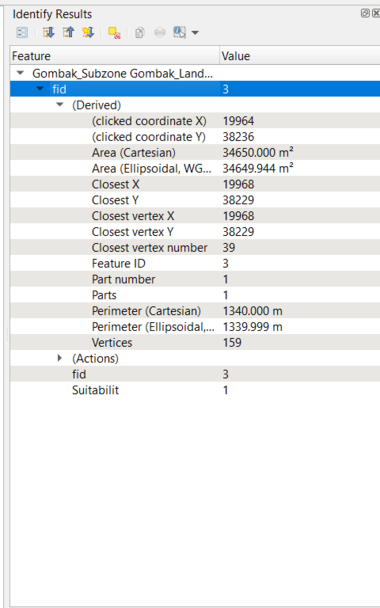
For better illustration and to determine the most suitable land lot, the total score layer has been polygonised to find out which area within Gombak has a high suitability score. As a result, the area in yellow and labelled with a suitability score of one, located at the far south region of Gombak, is the most suitable land lot determined.
As the selected land lot is illustrated with the raster layer for suitability land lot(s), the selected land lot is justified to be suitable as the area of the selected land lot has the highest suitability score of the raster layer.
Also, the total area of the selected land lot, which is 34650 m2, fulfils the size of land required that is at least 10000 m2.
Methods of Computation
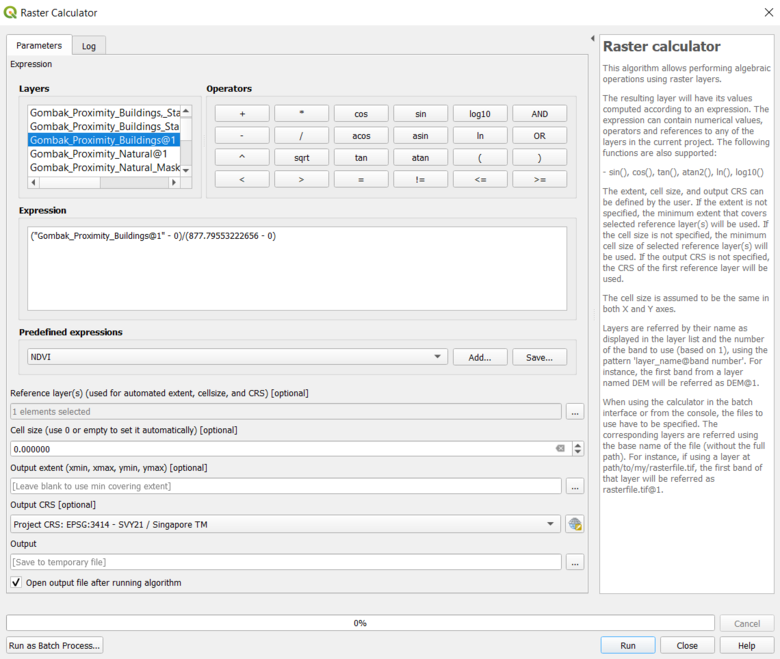
The diagram above shows how the standardisation of proximity to buildings, one of the factor layers, has been computed. The method used to compute the standardisation of proximity of buildings is by using the Min-Max method, where (x - xmin)/(xmax - xmin). This also applies to the computation of the standardisation for proximity to service roads and tracks and natural features as well as the slope analysis.
The diagram above shows how the total score raster layer has been computed in order to determine suitable land lot(s) within Gombak. Each factor layer has been multiplied with its respective AHP score which has been computed through the AHP input matrix. This enables the factor layer with the highest importance to be considered with high weightage compared to the other factor layers which are less important.
