SMT201 AY2019-20T1 EX2 Au Xue Qi Vanessa
Contents
- 1 Take-home Exercise 2
- 1.1 Gombak and the target features
- 1.2 Target roads
- 1.3 Buildings
- 1.4 Natural features
- 1.5 Digital elevation
- 1.6 Gombak and its proximity to 4 different features
- 1.7 Proximity of Gombak to target roads
- 1.8 Proximity of Gombak to buildings
- 1.9 Proximity of Gombak to natural features
- 1.10 Proximity of Gombak to elevated (sloped) areas
- 2 Maps with criterion scores
- 3 AHP Matrix And Result Report
- 4 Identification of suitable land lot(s) in Gombak
Take-home Exercise 2
Gombak and the target features
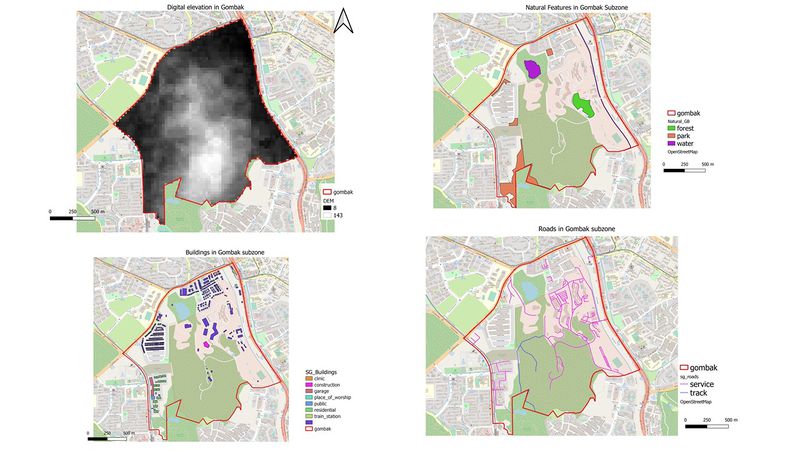
The above is an image containing 4 different maps of the study area, Gombak with different layers such as:
- Target roads
- Buildings
- Natural features
- Digital elevation
Target roads
Depicted are the service and track roads in Gombak, which is a part of the decision criteria when selecting a location for the disease centre.
Buildings
The buildings were classified by their types. From this map, I can see the different types of buildings and note which areas to avoid (residential, etc).
Natural features
The 3 types of natural features in Gombak (water, park, forest) are depicted in this map. This provides me with a clear understanding of the areas in Gombak that I should avoid when deciding on a location for the disease centre.
Digital elevation
Darker areas indicate that there is little elevation in those areas, while lighter and white areas on the map indicate higher digital elevation. This helps me to pinpoint areas that I should avoid when choosing the location for communicable diseases centre.
Gombak and its proximity to 4 different features
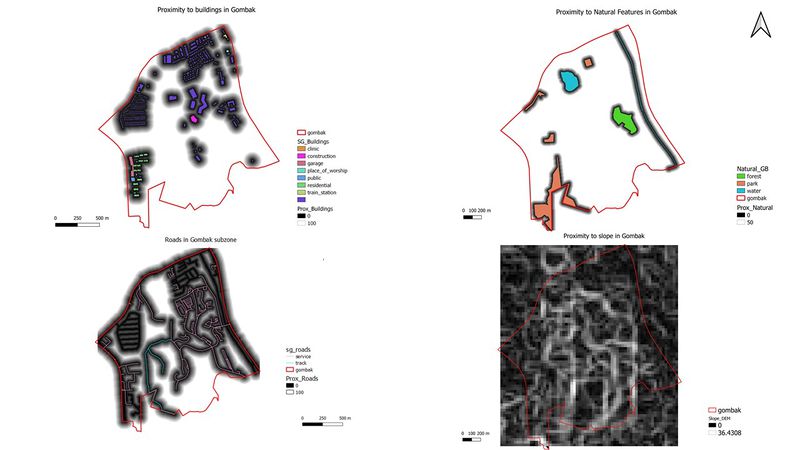
The above is an image containing 4 different maps of the study area, Gombak with different layers with regard to the proximity of the features from Gombak.
- Proximity of Gombak to target roads
- Proximity of Gombak to buildings
- Proximity of Gombak to natural features
- Proximity of Gombak to elevated (sloped) areas
Proximity of Gombak to target roads
The proximity of roads to the nearest land lot ranges from 0 to 706.045m. The centre should be located near service roads and tracks to ensure easy transportation of materials during construction. These 2 types of roads are indicated on the map in pink and light blue respectively. Hence, areas in black are more ideal as they are nearer to the target roads.
Proximity of Gombak to buildings
The proximity of buildings to the nearest land lot ranges from 0 to 826.62m. As the Centre for Communicable Diseases must not be located near populated areas such as residential and offices, the map clearly indicates the populated areas that I should avoid when making my final decision regarding the location of the centre. Areas in white would be most ideal as they are away from the target buildings.
Proximity of Gombak to natural features
The proximity of natural features to the nearest land lot ranges from 0 to 863.669m. As the centre should not be near forested land, parks or water, the white areas would indicate ideal locations and areas for the centre to be built.
Proximity of Gombak to elevated (sloped) areas
The proximity of slopes to the nearest land lot ranges from 0 to 36.4308m. The centre should not be built on a slope as this would affect the economic costs during construction. After creating this map, the darker areas indicate that the land is less elevated compared to white areas which are more elevated.
Maps with criterion scores
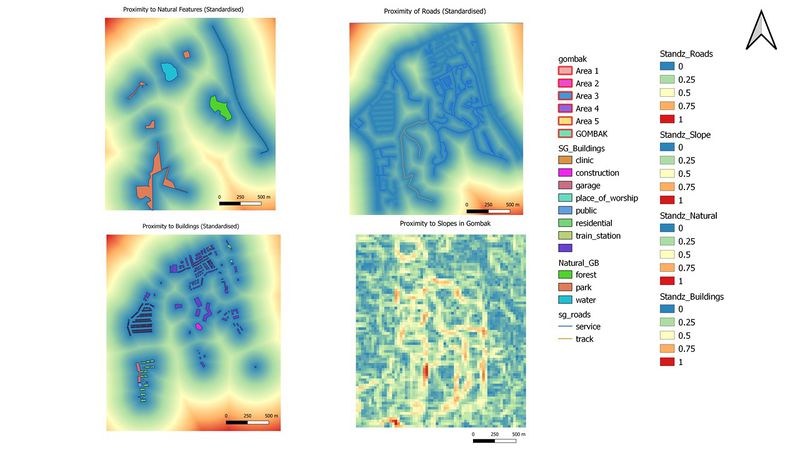
Above is an image containing the criterion scores for the following features listed below. All standardized criteria scores range from 0-1. A higher criterion score suggests that the plot of land is more suitable for the construction of the Communicable Diseases centre for each respective layer. The following standardized criteria scores are further elaborated below for each layer.
Standardised proximity of Gombak to target roads
1 - ("Prox_Roads@1" - 0) / (706.045288085938 - 0)
Standardised proximity of Gombak to buildings
("Prox_Buildings@1" - 0) / (826.62 - 0)
Standardised proximity of Gombak to natural features
("Prox_Natural@1" - 0) / (863.669 - 0)
Standardised proximity of Gombak to elevated (sloped) areas
("Slope_DEM@1" - 0) / (36.4308 - 0)
AHP Matrix And Result Report
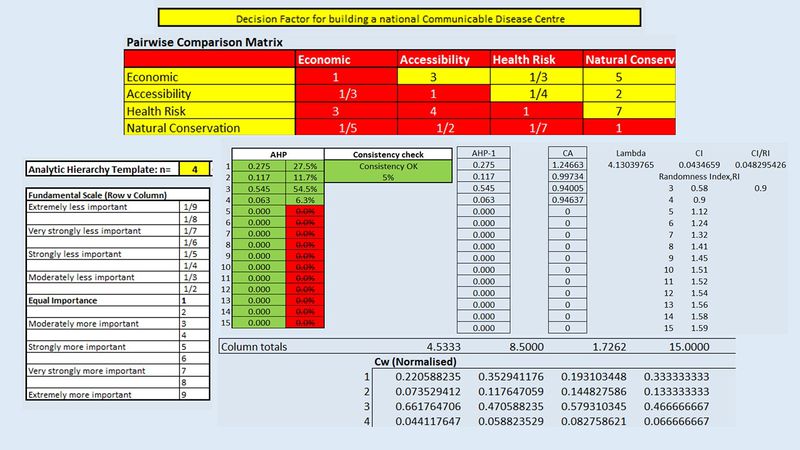
An Analytical Hierarchical Process input matrix and result report
According to the AHP matrix, the scores are as follows:
- Economic factor: 0.275
- Accessibility: 0.117
- Health risk: 0.545
- Natural conservation: 0.063
A higher AHP score indicates that the factor is more important. Hence in this case, health risk (proximity to buildings) has the highest importance out of all the factors. The consistency check shows 5%, which is below 10%, suggesting that the AHP matrix can be used as reference.
Identification of suitable land lot(s) in Gombak
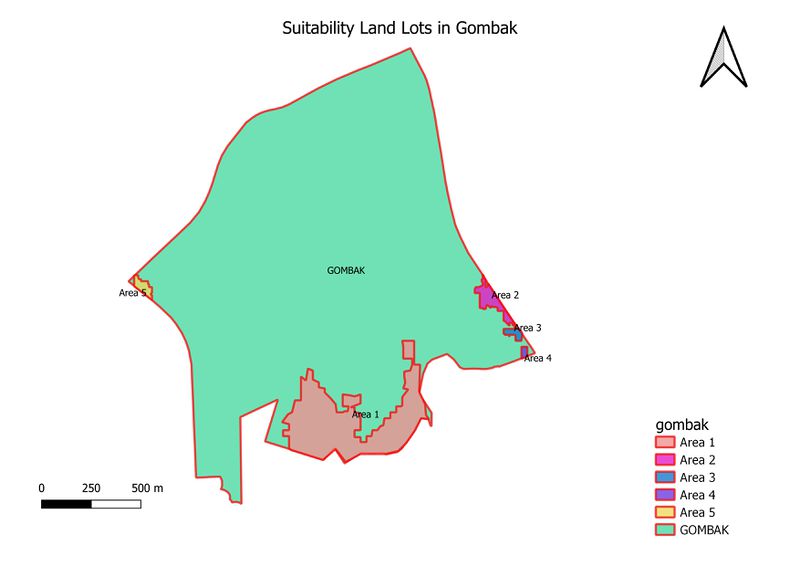
After reclassifying the raster table, I have picked out 5 areas that are suitable for constructing the communicable disease centre. Below are the areas (in m2) of each of the 5 selected areas:
- Area 1: 177946.923924
- Area 2: 13781.0578335
- Area 3: 3648.57919103
- Area 4: 1649.35816811
- Area 5: 5597.82830978
After considering the requirements such as the 10,000m2 contiguous area, I have selected Area 1 as the final land lot that is most suitable for the Communicable Disease centre.
