SMT201 AY2019-20G1 Ex2 Lim Shen Jie
Contents
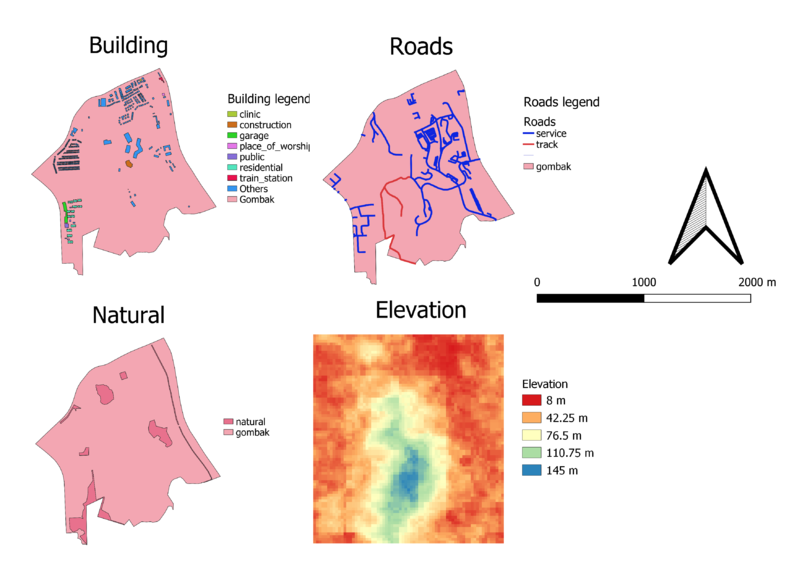
Part 1: Standard view of study areas
Description
1. Buildings - Classified buildings by color into clinic, construction, garage, place of worship, public, residential, train station, and others.
2. Natural - Classified natural as one single color.
3. Roads - Classified roads into service and track. Any other type of roads were excluded from the study.
4. Elevation - Classified the elevation into colors, representing different heights
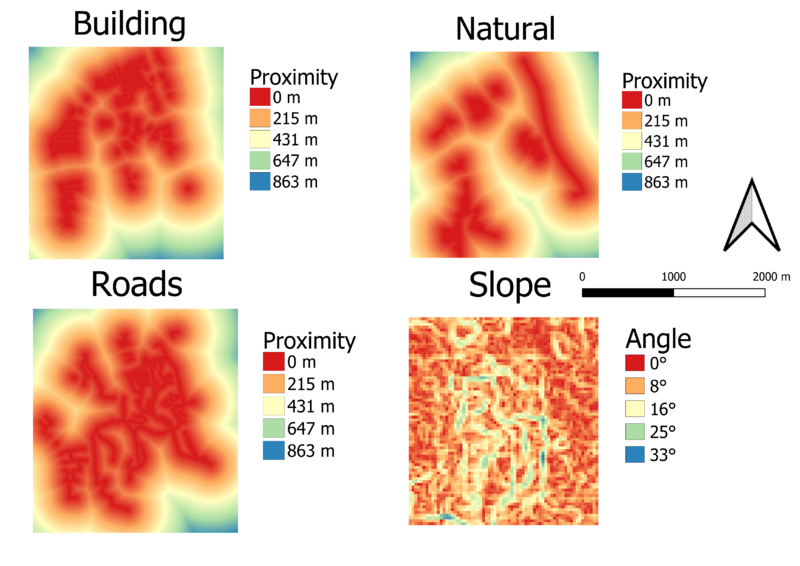
Part 2: Raster view of the study areas
Description
1. Buildings - Classified proximity by color. Numbers are in metres.
2. Natural - Classified proximity by color. Numbers are in metres.
3. Roads - Classified proximity by color. Numbers are in metres.
4. Elevation - Classified proximity by color. Numbers are in metres.
Part 3: Raster view showing the criterion scores of the study areas
Description
1. Buildings - Classified proximity by color. Numbers are standardized using Min-max method.
2. Natural - Classified proximity by color. Numbers are standardized using Min-max method.
3. Roads - Classified proximity by color. Numbers are standardized using Min-max method.
4. Elevation - Classified proximity by color. Numbers are standardized using Min-max method.
Part 4: AHP tables
Description
1. Buildings - Classified proximity by color. Numbers are standardized using Min-max method.
2. Natural - Classified proximity by color. Numbers are standardized using Min-max method.
3. Roads - Classified proximity by color. Numbers are standardized using Min-max method.
4. Elevation - Classified proximity by color. Numbers are standardized using Min-max method.
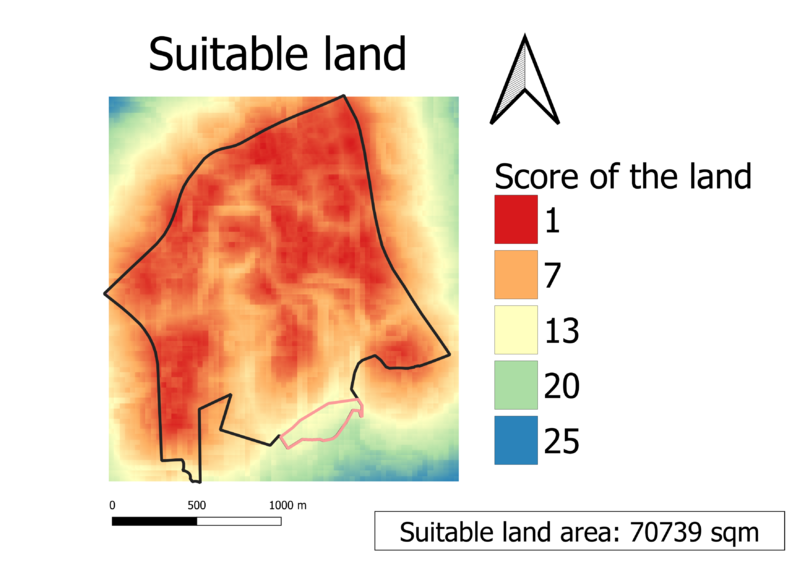
Part 5: Suitable land
Discussion
Sources
1. Master Plan 2014 Subzone (No Sea)
2. BBBike@Singapore
3. ASTER Global Digital Elevation Model (GDEM) dataset


