SMT201 AY2019-20T1 EX2 Tan Hui Qin
Contents
The Objective
This study seeks to find a suitable area for building a national Communicable Disease Quarantine Centre in our target planning area, Gombak. The following factors will be considered and these are the methods I will be using to study them.
Accessibility Factor
The selected site should be close to existing local roads, namely: service roads and tracks. This is to ensure easy transportation of building materials during the construction stage. Hence, we will study the location of roads and map out the proximity maps with reference to the roads to identify areas closer to service roads and tracks.
Health Risk Factor
The selected site should be away from population i.e. housing areas and offices in order to avoid disease spreading to the nearby population. Hence, we will study the location of buildings and map out the proximity maps with reference to the buildings to identify areas further away from buildings.
Natural Conservation Factor
The selected site should be away from forested land, park and water. Hence, we will study the location of natural features and map out the proximity maps with reference to the natural features to identify areas further away from natural features.
Economic Factor
The selected site should avoid steep slope. This is because construction at steep slope tends to involve a lot of cut-and-fill and will lend to relatively higher development cost. Hence, we will study the slope and elevation of the our target land area to find the area with the gentlest slope so that construction costs can be minimized.
The Study Area
Roads
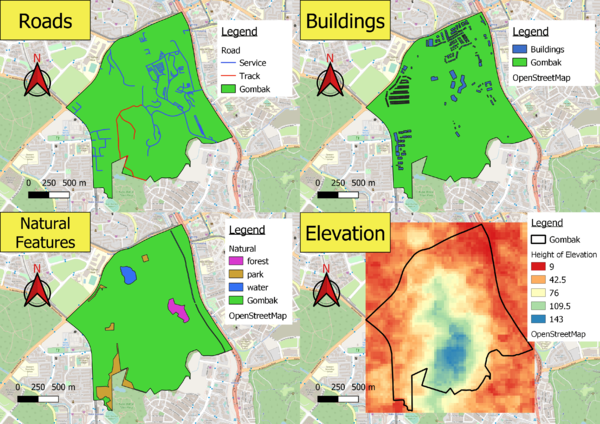
Since we only want to find out the accessibility of the Quarantine Centre from service roads and tracks, I classified the roads according to their type and kept only features that were classified under service and track. I used different colours to differentiate the type of roads. There are 186 features of service roads located around Gombak and 2 features of track roads located in the northern area of Gombak.
Buildings
Since the study of the location of buildings is to find out the proximity where humans will be from the selected location, I did not differentiate the different types of buildings on the map. This is because the type of buildings that are in Gombak are clinics, construction sites and residential etc., all of which have a significant human population existing within them. Hence, they can all be treated the same. The buildings are situated all around Gombak except for the Southern and South-Eastern parts of Gombak which has a lower density of buildings.
Natural Features
Natural features on the map were classified into forest, park and water and different colours were used to present the different polygons. There are 4 features of parks that are situated around the western and northern parts of Gombak. There are 3 features of water with one feature situated around northern Gombak while the other two are stretched along eastern Gombak. There is 1 forest feature in central Gombak.
Elevation
Using the ASTER Global Digital Elevation Model (GDEM) dataset jointly prepared by NASA and METI, Japan, I was able to rasterize and classify the height of elevation for Gombak. According to the map, the height of elevation is highest around southern and central Gombak and reduces as we move further away from the Gombak area.
The Factors
Proximity to Roads
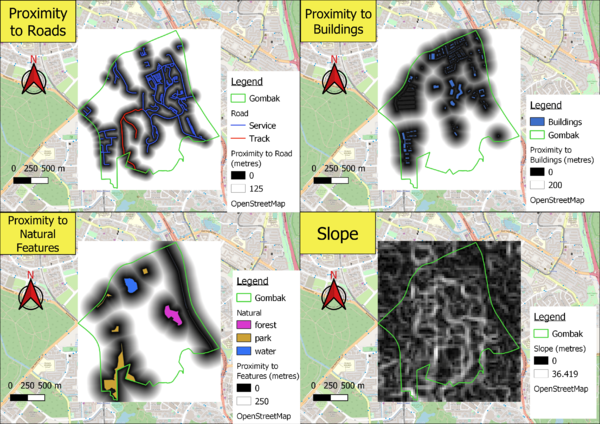
By performing rasterization on the road map, I was able to perform a raster analysis to produce this map that shows the proximity of an area from the service and track roads in Gombak. The darker the area of the map, the closer it is to the roads shown on the map. This also means the darker the land area, the more accessible it will be for the new quarantine centre during construction. The maximum distance of a 5m by 5m land area that the proximity map shows is 125m away from a road, however the true maximum distance of a land area from a road is 743.3m.
Proximity of Buildings
Similarly, I performed raster analysis and produced the map that shows proximity of an area from buildings in Gombak. The darker the area of the map, the closer it is to the buildings shown on the map. This also means the darker the land area, the greater the health risks that will be exposed to humans if the new quarantine centre is to be built there. The maximum distance of a 5m by 5m land area that the proximity map shows is 200m away from a road, however the true maximum distance of a land area from a road is 838.5m.
Proximity to Natural Features
Similarly, I performed raster analysis and produced the map that shows proximity of an area from natural features in Gombak. The darker the area of the map, the closer it is to the natural features shown on the map. This also means the darker the land area, the greater the risk of contamination of natural features like waterbodies will occur if the new quarantine centre is to be built there. The maximum distance of a 5m by 5m land area that the proximity map shows is 250m away from a road, however the true maximum distance of a land area from a road is 863.7m.
Slope
Since the elevation map was already in raster form, there was no need to rasterize it. Instead, I did a slope analysis to find out the degree of elevation for the land area in Gombak. The legend of the map shows that the minimum and maximum steepness of the slope is 0 and 36.419 respectively with darker areas representing gentler slopes whiter areas representing steeper slopes. We can see that Gombak has a overall uneven surface land area. The land area of Gombak generally has gentler slopes.

