SMT201 AY2019-20T1 EX2 Heng Bing Chow
Contents
Location for Communicable Disease Quarantine Centre (CDQC) in Gombak
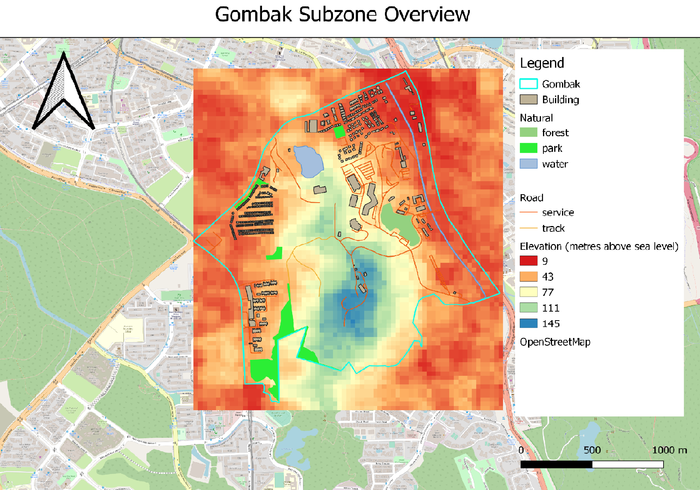
In order to determine a suitable location for building a national Communicable Disease Quarantine Centre, the selected site must 1) be located at Gombak planning subzone , and 2) it must meet the four decision factors:
- Economic factor: The selected site should avoid steep slope to prevent additional development costs such as cut-and-fill of land.
- Accessibility factor: The selected site should be close in proximity to existing local roads, namely: service roads and tracks. This is to ensure easy transportation of building materials during the construction stage.
- Health risk factor: The selected site should be away from population i.e. housing areas and offices in order to avoid disease spreading to the nearby population.
- Natural conservation factor: The selected site should be away from forested land, park and water.
Features in Gombak
Data Source: [Elevation] ASTER Global Digital Elevation Model (GDEM) dataset (TIFF) jointly prepared by NASA and METI, Japan; raster dataset combined by Professor Kam Tin Seong.[1].
[Gombak] Master Plan 2014 Subzone Boundary (No Sea) (SHP) from URA.[2].
[Building, Natural and Road] Building, Natural and Road (SHP) from OpenStreetMap.[3].
Data Source: [Elevation] ASTER Global Digital Elevation Model (GDEM) dataset (TIFF) jointly prepared by NASA and METI, Japan; raster dataset combined by Professor Kam Tin Seong.[4].
[Gombak] Master Plan 2014 Subzone Boundary (No Sea) (SHP) from URA.[5].
[Building, Natural and Road] Building, Natural and Road (SHP) from OpenStreetMap.[6].
Description of Map Views
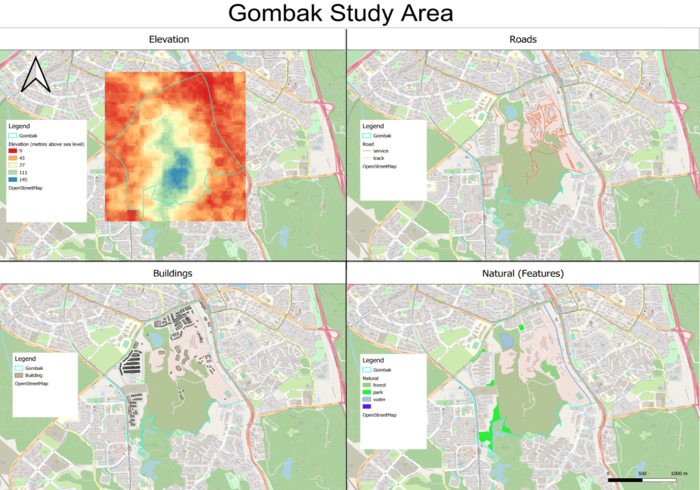
Elevation (Economic Factor):
From the Elevation map view, we can see that the terrain from the center to the south of Gombak is very elevated, with 145m above sea level as its maximum. This is hinting that there is a hill, and we should avoid that area when building the CDQC to avoid cut-and-fill of land.
Roads (Accessibility Factor):
From the Roads map view, we can see that the majority of the 'service' type road networks are located at the North/Northeast part of Gombak. This tells us that we should consider the North/Northeast part of Gombak as the ingress and egress during the initial construction phase of the CDQC.
Buildings (Health Risk Factor):
From the Buildings map view, we can see that the majority of the buildings are located at the North/Northwest part of Gombak. This tells us that we should consider the southern part of Gombak as the location to build the CDQC to avoid the spread of disease.
Natural (Features) (Natural Conservation Factor):
From the Natural (Features) map view, we can see that the Gombak is generally surrounded by parks, forest and water bodies. However, there is a area located on the Southeast side of Gombak without natural features, which could be an ideal location to build the CDQC.
Proximity of features and Slope Analysis in Gombak
Description of Proximity Map Views
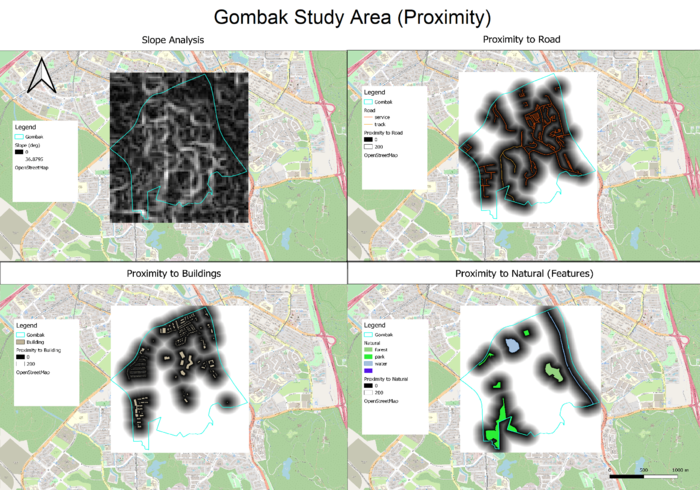
Slope Analysis: As seen in the Slope Analysis Map View, Gombak has quite a lot of contour lines with a maximum steepness of 37 degree, as indicated by the white curved lines on the map.The black areas on the map indicates that the terrain is generally flat or has a gentle slope. Black areas represent areas that we should consider building the CDQC, in view of the Economic factor.
Proximity to Road: As seen in the Proximity to Road Map View, Gombak is generally well connected, with roads connecting throughout the area, except for a few pockets in the Northwest and Southeast part. The black areas on the map indicates that the area is within 100 metres to the closest road and should be considered when deciding the location for the CDQC, in view of the Accessibility factor.
Proximity to Buildings: As seen in the Proximity to Buildings Map View, buildings in Gombak are more concentrated at the Northern part, as indicated by the black areas on the map. Black areas represents areas that are within 200 metres of a building, and should be avoided when building the CDQC, in view of the Health Risk factor.
Proximity to Natural (Features): As seen in the Proximity to Natural (Features) Map View, the perimeters of Gombak has the most amount of natural features. The black areas on the map represent areas that are within 200m of a natural features, and should be avoided when building the CDQC, in view of the Nature Conservation factor.
Criterion Scores of factors in Gombak
Description of Criterion Map Views
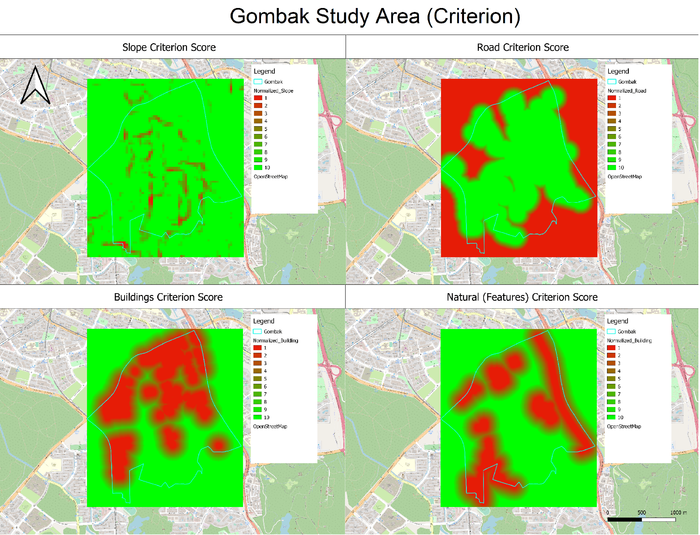
This map view is created by standardizing each factor (Slope, Road, Building, Natural) with scores from 0 to 10, and the constraints are listed below.
As every factor has been standardized, a higher score is better across the factors.
Slope Criterion Score: Areas within 0 to 15 degress gets a score of 10, each subsequent 2 degree increase results in a reduction of 1 point.
Road Criterion Score: Areas within 100 metres gets a score of 10, each subsequent 10 metre increase results in a reduction of 1 point.
Buildings Criterion Score: Areas further than 200 metres gets a score of 10, each subsequent 20 metre decrease results in a reduction of 1 point.
Natural (Features) Criterion Score: Areas further than 200 metres gets a score of 10, each subsequent 20 metre decrease results in a reduction of 1 point.
Analytical Hierarchical Process Input Matrix
Description of Analytical Hierarchical Process Input Matrix
https://www.google.com/url?sa=t&rct=j&q=&esrc=s&source=web&cd=17&ved=2ahUKEwi198HV87_lAhXhjuYKHWn1AnEQFjAQegQICRAC&url=http%3A%2F%2Fwww.scbuk.com%2FAHP%2520Template%2520SCBUK.xls&usg=AOvVaw002J8QfYIxOE_I9PYqrH8_ As seen in the matrix above, the most critical factor is Health Risk, with a AHP of 54.6%. Nature Conservation has the least AHP of 4.7%, which means that this factor would hold the least weight when considering where to build the CDQC, and vice versa for Health Risk. According to the Consistency Check, a 9% consistency is within acceptable range, which proves the validity of the matrix.
Land Suitability Lot(s)
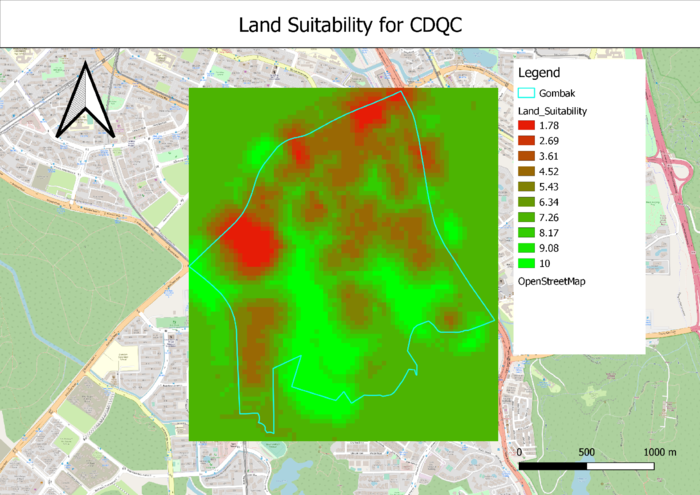
After using the Raster Calculator in QGIS to calculate the new weighted criterion score, I was able to create the Land Suitability map view.
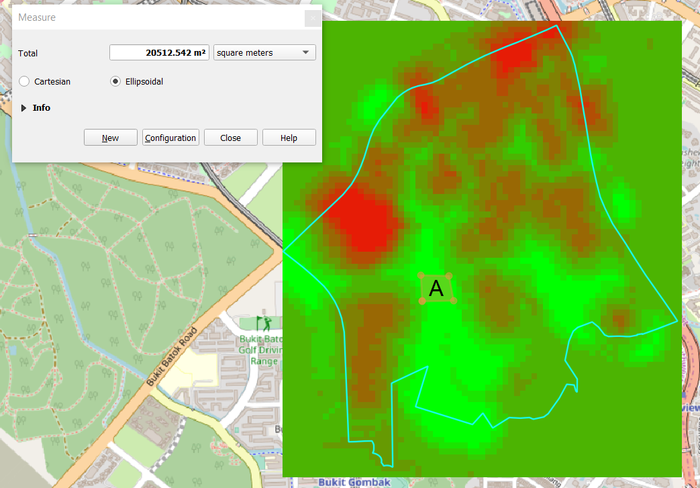
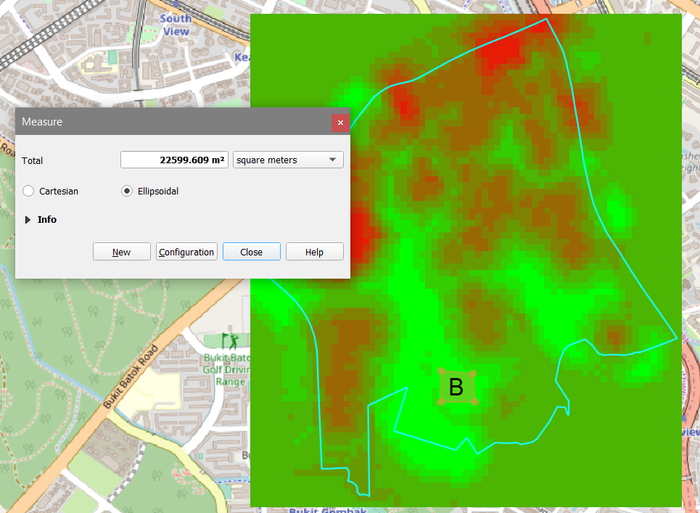
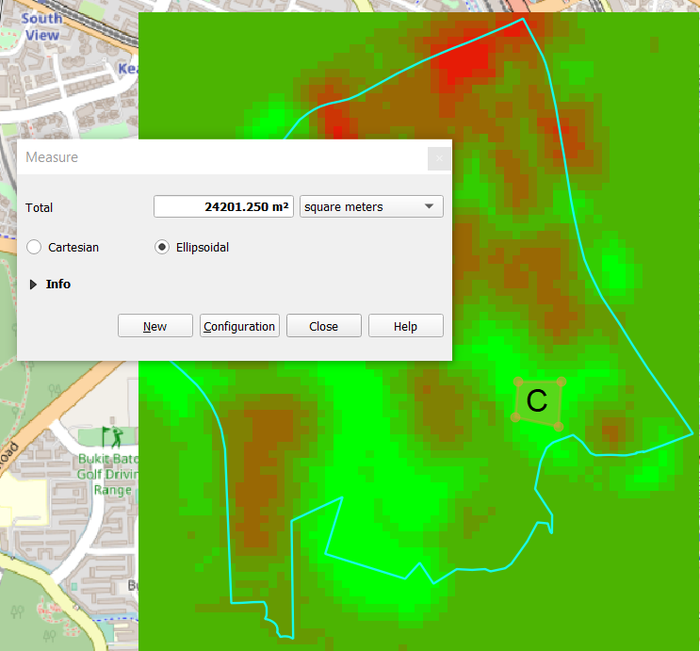
Using the Measure Area tool in QGIS, I was able to identify 3 locations to build the CDQC.
Location A
Location A has a contiguous area of 20512m2, which fulfills the condition of at least 10,000m2. However, Location A has the least contiguous area compared to Location B and C.
Location B
Location B has a contiguous area of 22599m2 which fulfills the condition of at least 10,000m2. Location B might be the best location to build the CDQC as it is not surrounded by red areas, which denotes location that might risk the 4 factors.
Location C
Location C has a contiguous area of 24201m2 which fulfills the condition of at least 10,000m2 Even though Location C has the biggest contiguous area compared to Location A and B, it is still relatively surrounded by red areas.
Conclusion
Location B should be the best location to build the CDQC.
