SMT201 AY2018-19T1 EX1 Aaron Lee Tian En
Contents
Part One: Thematic Mapping
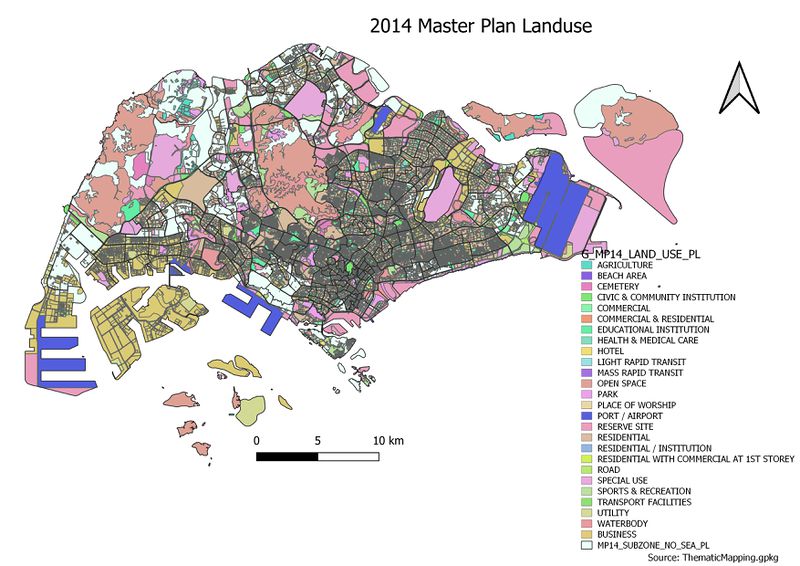
2014 Master Plan Landuse
I noticed the BUSINESS had many sub categories and that made the map very grey (too many things on it) and the program took a while to load the map. So I combined all the sub categories for business and labelled it as business. That also made the legend much simpler and the map is better classified showing each area having which type of land use.
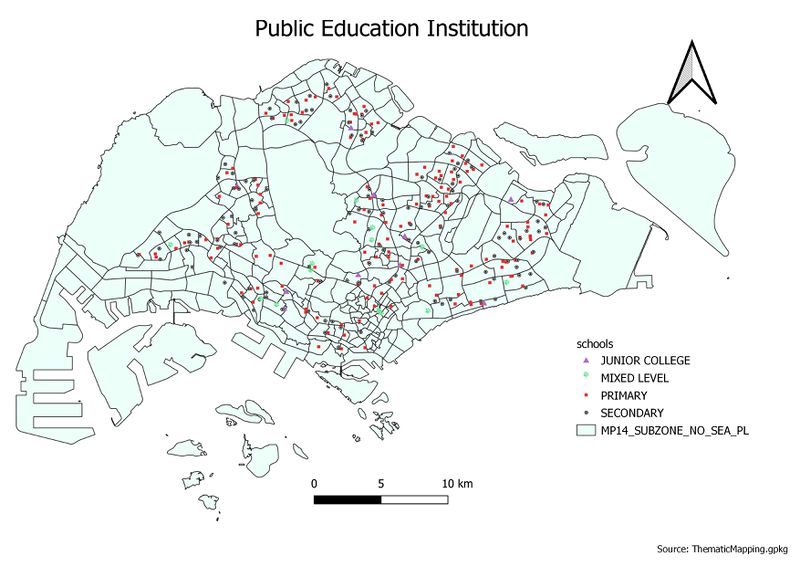
Level of Schools
I used different symbols and different colours to represent the 4 levels of institutions on the map. I had to decrease the size for all of the symbols because the large symbols were overlapping others. From the map, primary and secondary schools are much more in numbers as compared to JC and mixed levels.
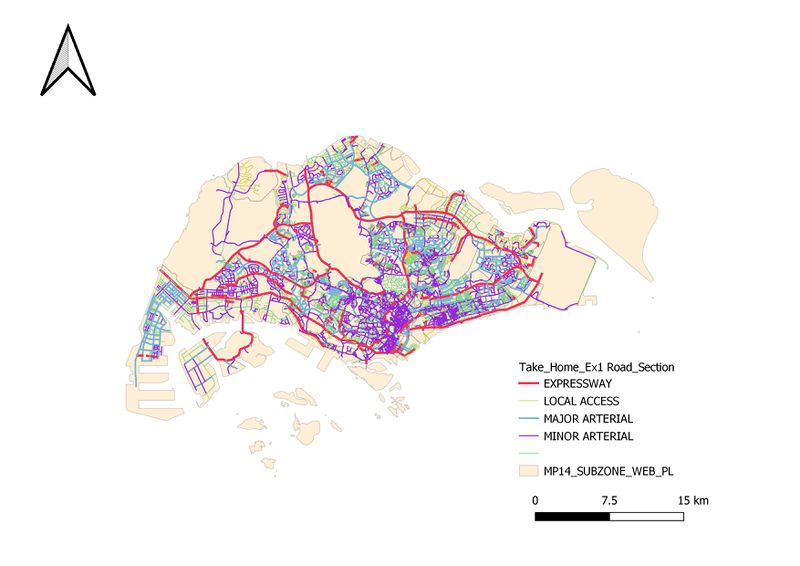
Road Network System
I decided to put the Expressways as the thickest line and minor roads as the thinnest line and the 3 types of roads are different colour. This was to give a clear representation of the roads even without looking at the legend. Also, I differentiated the major and minor roads based on whether the naming had the word "road" in it. Those with the word "road" I classify them as major road. Those with "Lorong/ Jalan / street / Lane" are all classified as minor roads.
Part Two: Choropleth Mapping
2014 Master Plan Landuse
2014 Master Plan Landuse
2014 Master Plan Landuse
2014 Master Plan Landuse
2014 Master Plan Landuse
Some texttfg
