SMT201 AY2019-20T1 EX2 Lee Shanzhen Leandra Faith
Part one
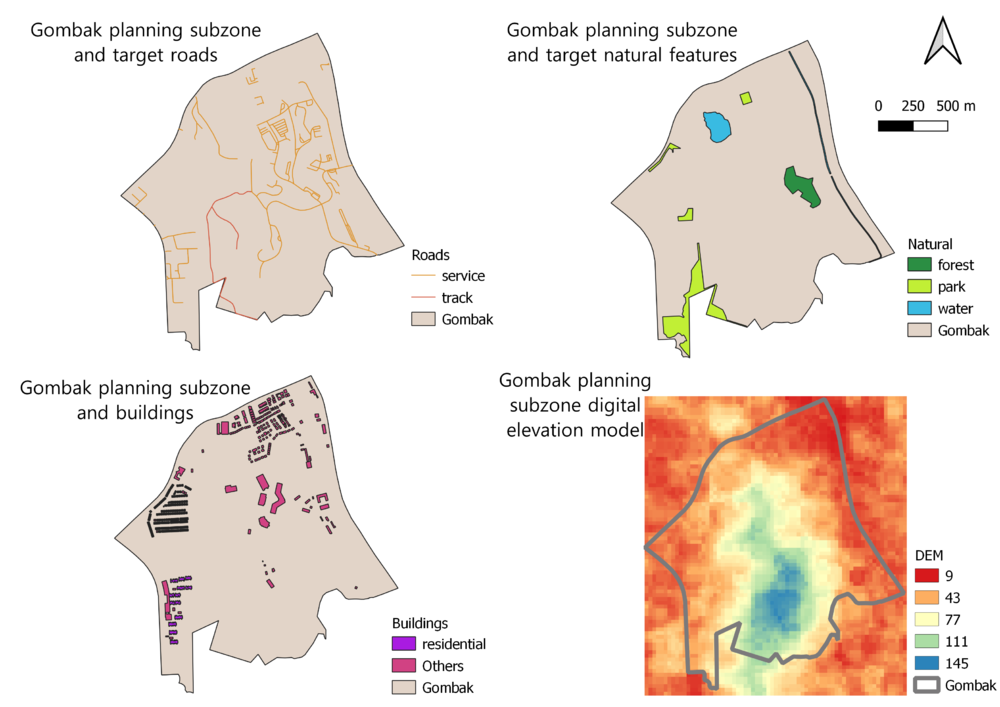
Map layout with four views showing
- study area and target roads
- study area and target natural features
- study area and buildings
- study area and digital elevation
Target roads: It was stated in the task description that we are only interested in service roads and tracks, so I did a selection of features by expression to extract only those roads with type = service or type = track. Then I used categorised symbology to symbolise the 2 types of roads, where orange indicates service road and red indicates track.
Target natural features: Similar to what I did with the road lines, I used categorised symbology and symbolised the different natural features (forest, park and water) using different colours.
Buildings: The task description stated that the selected site should be away from the population. In particular, housing areas and offices were of interest. However, from the OpenStreetMap data, I could only identify residential buildings to represent housing areas. There were no building types in the data set that indicated the presence of offices. Thus, I have identified all the residential buildings in purple, while all other buildings are in pink. Buildings in the 'Others' category include construction, garage, clinic, place of worship, public, and train station.
Digital Elevation: I used the 'clip raster by extent' function in QGIS to extract the digital elevation model for Gombak.
Part two
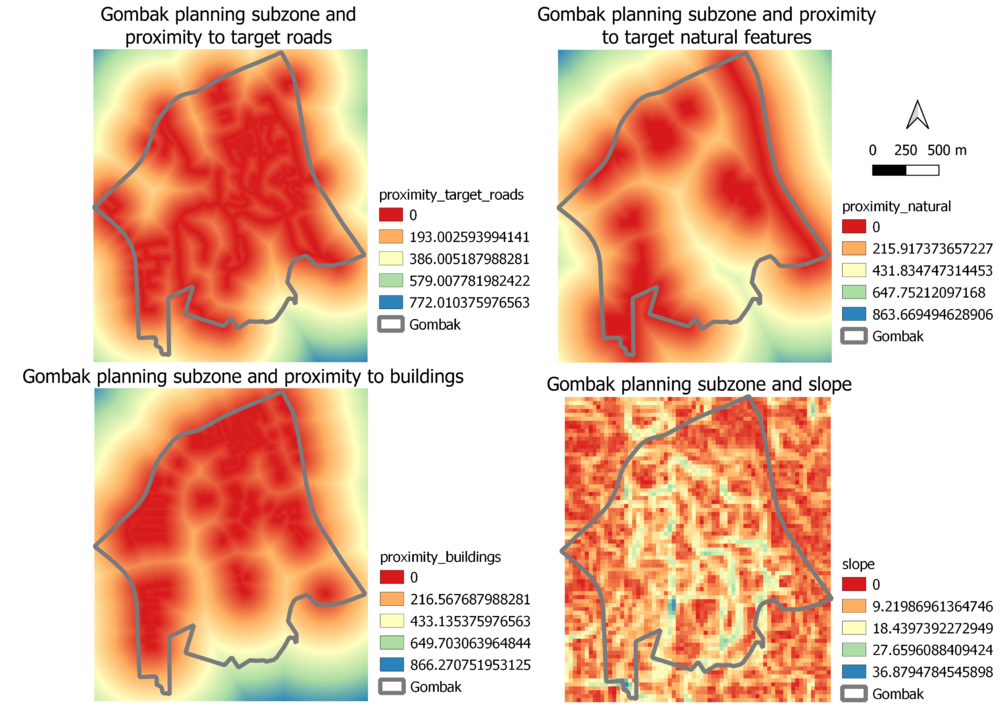
Map layout with four views showing
- study area and proximity to target roads layer
- study area and proximity to target natural features layer
- study area and proximity to buildings layer
- study area and slope layer
In order to derive the proximity to roads, natural features and buildings, I needed to first rasterise the various layers. Then, I used the proximity function in QGIS to compute the proximity for every layer. I used the slope function in QGIS to compute the slope layer from the DEM layer.
Part three
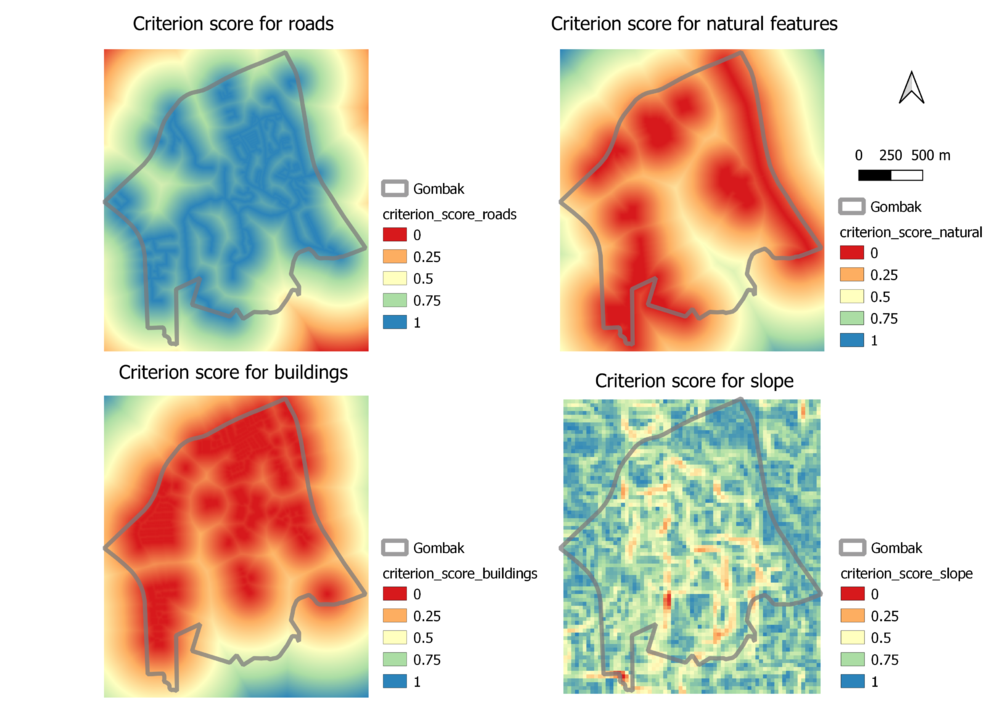
A map layout with four views showing the criterion scores for each factor layer and a short description of not more than 150 words for each view.
I used the min-max criteria standardisation technique to first standardise every layer, such that the values range between 0 and 1. However, this was not sufficient because higher values for 'buildings' and 'natural' layers were better, whereas lower values for 'roads' and 'slope' layers were better. Thus, for 'roads' and 'slope' layers, I further modified the values by taking 1 - standardised_values, so that a higher score (between 0 and 1) would be preferred.
Part four
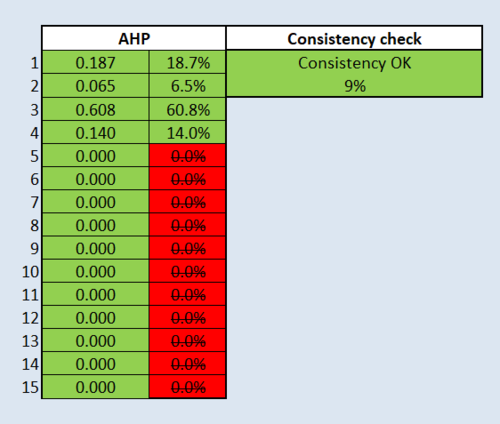
An Analytic Hierarchy Process (AHP) input matrix and result report and a short description of not more than 150 words discussing the analysis results.
The results show that the consistency is close to 10%, indicating that it is consistent. Health risk is the most important factor, followed by economic, natural conservation and accessibility. The main purpose of this quarantine centre is to control the spread of communicable diseases, thus, the health risk factor should be given the highest weightage.
Part five
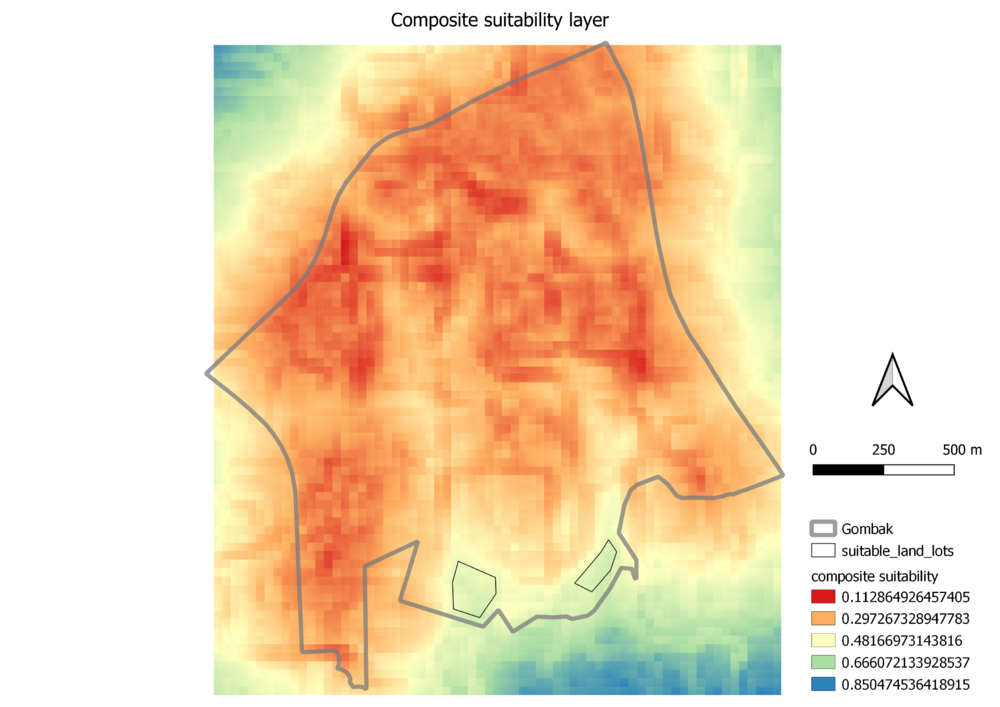
A map layout with the suitability land lot(s) and a short description of not more than 200 words commenting on each suitable land lot identified.
I have identified two suitable land lots to locate the Communicable Disease Quarantine Centre. The larger land lot has a contiguous area of 21918.767m2 while the smaller land lot has a contiguous area of 11199.757m2, as measured using the 'measure area' tool in QGIS. Of the two, I think the larger one would be a better choice as it is more evenly shaped, whereas the other land lot is narrower.
Data sources
https://data.gov.sg/dataset/master-plan-2014-subzone-boundary-no-sea
