SMT201 AY2019-20G1 EX2 Moh Qing Loong Darren
Contents
Part 1: Map Layout with four views
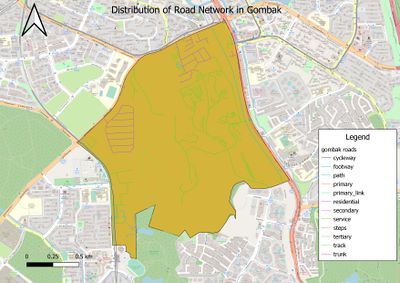
Gombak Road - showing the study area and the target roads
Description:
The study area featured is Gombak, which is represented by brown. I use categorised symbols to show the different types of roads in the road network. There are cycling, footway, path paths, which are built for residents and public use. I labelled the paths with different colours instead of black to signify the distinction between different roads as it could be used for walking, transport. This is a general view, but further analysis on specific roads will be conducted to discuss in the later part.
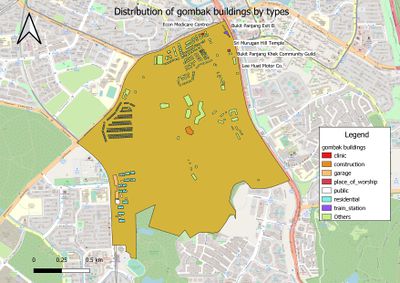
Gombak Buildings - showing the study area and buildings
Description: In Gombak, the distribution of buildings are quite scattered. Public blocks occupy most of the buildings that are presented. I chose to use simple fill to display all the buildings because it is much easier to identify residence from public buildings. The svg marker is not particularly useful when it comes to marking out similar features that are clustered near each other in Gombak. The lighter tones are used to symbolise buildings, so as to contrast and provides clarity. For clinics, garage and construction, i used the colour thought to be afflicted with what they are. There are other unknown buildings that are unclassfied.
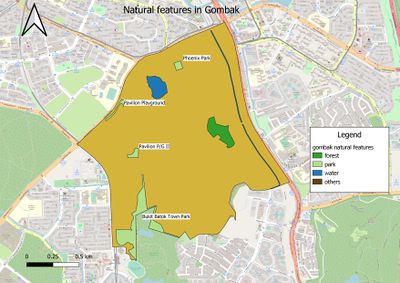
Gombak's natural features - showing the study area and the target natural features
Description: For Gombak's dwellers, families with children may visit the playground and parks, residents from all walks of life will also utilise the bukit batok town park. Waterbodies are universally recognised as blue, hence blue was used. Forests is usually seen as green, parks consists of flowers, shrubs that appears greenish, but lighter. These are also important as they are populated with not only humans at certain days of the week, but also animals and are precious natural resources of singapore. Further analysis will be conducted to determine if they need to be relocated or considered for the building of the centre.
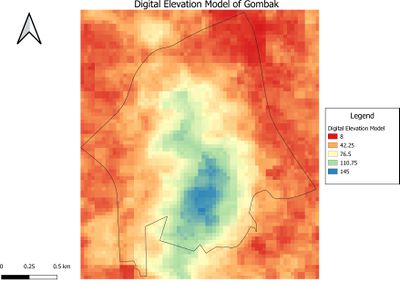
Digital Elevation Model of Gombak - showing the study area and the digital elevation model
Description: The digital elevation model shows gombak in the raster mode, where it is categorised into different colours.
Part 2: Map Layout with four views (Proximity)
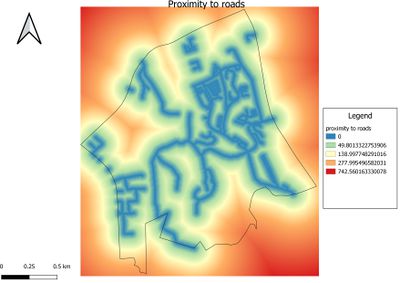
Gombak Road - showing the study area and proximity to target roads (For Accessibility factor)
Description:
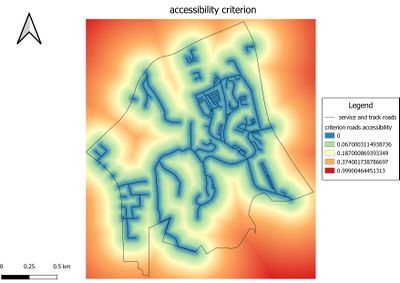
The legend of Proximity map layer indicates that the furthest distance from the roads is 742 metres. Particularly, we are concerned with service and tracks roads, as these are the roads that will be used to transport materials during the construction stage in the building phase. There are 199 service roads and only 2 tracks. Red indicate zero proximity while blue indicates the furthest range of distances, which is not ideal for transportation. Accessibility factor is determined by the shortest distance of the quarantine centre location to enable effective delivery of building materials. I defined it as less than or equal to 200m, the same numerical value used in class. It is relatively easy for a nearer vehicle to park, if closer proximity is not possible. It will facilitate transportation easier as the workers do not have to travel too far by walking from their vehicle.
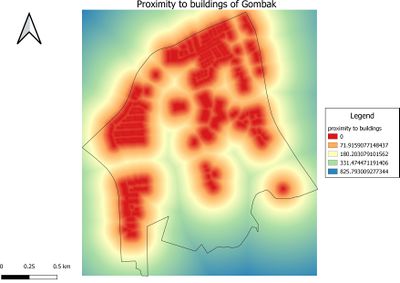
Gombak Buildings - showing the study area and proximity to buildings (For Health factor)
Description:
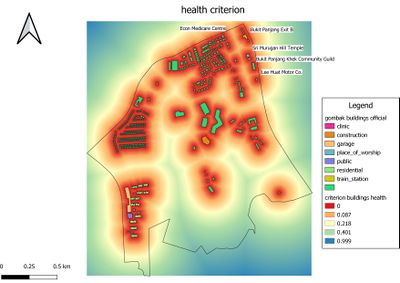
The legend of Proximity map layer indicates that the furthest distance from the buildings is 825 metres. The health
risk posed by the national communicable disease centre should not be undermined. As it houses patients who are infected with diseases. These diseases may be transmitted by air or water. The contagious disease will be harder to quanrantine in the event should it happen. Therefore, the further the centre can be built, the better it will be for the healthy population.
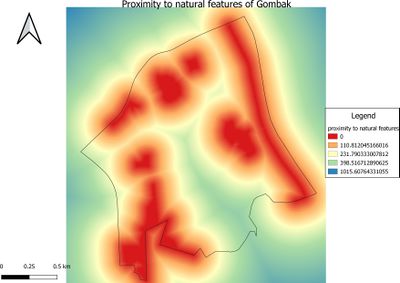
Gombak's natural features - showing the study area and the proximity to target natural features (For Natural conservation factor)
Description:
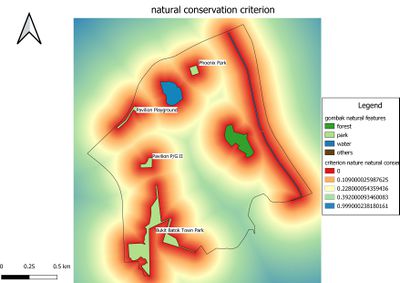
The legend of Proximity map layer indicates that the furthest distance from the natural features is 1015 metres. Under natual conservation factor, we identified pavilion, bukit batok parks, forested land. There is 1 major park, 1 forest and 1 waterbody. A minor reason is for aesthetic purpose. It is to preserve the beauty and scarcity of the remaining natural features, as well as the aninmal biodiversity that is present in forest and parks.
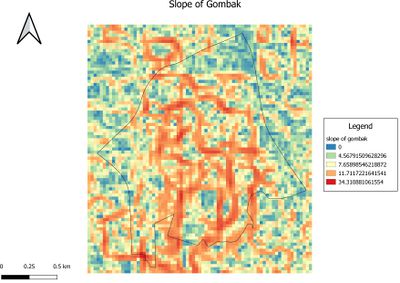
The slope of Gombak - showing the study area and the slope (For economic factor)
Description:
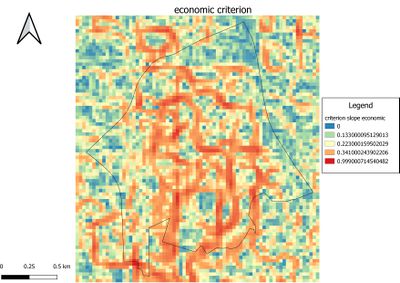
The legend of Slope layer shows that the minimum and maximum values of the slope values are 0 and 34.3 degrees respectively. Under economic factor, it is regarded to be more costly if the centre were to be built on a steeper slope, rather than building on a flat slope. With a sharp inclination, it is also impossible to build. Hence, an ideal slop incliantion is less than 15 degrees. The red regions are the best to build the centre, when the centre is cheap to build. The blue regions are not ideal for building and urban planners, developers are advised not to target these places.
Part 3: May Layout with four views (Criterion Scores)
Description: 1)Economic factor
Economic factor: The selected site should avoid steep slope. This is because construction at steep slope tends to involve a lot of cut-and-fill and will lend to relatively higher development cost.As such, we define steep slopes as those more than 15m. The black grids indicate locations with slope value greater than 15 degrees and white grids indicate locations with slope value less than or equal to 15 degrees.
2) Accessibility Factor
Accessibility factor: The selected site should be close to existing local roads, namely: service roads and tracks. This is to ensure easy transportation of building materials during the construction stage. The estimated ideal distance is less than 201m. The black grids indicate locations with distances greater than 200m and white grids indicate distances less than or equal to 200m.
3) Health Risk Factor
Health risk factor: The selected site should be away from population i.e. housing areas and offices in order to avoid disease spreading to the nearby population. The communicable disease centre will be infectious and hence, it has to be built in a region notwithstanding 10000msquare. The black grids indicate undesirable locations and the white grids indicate ideal locations
4) Natural Conservation Factor
Natural conservation factor: The selected site should be away from forested land, park and water. Since diseases are transmitted by aquatic means, the communicable disease centre should also not be located near waterbodies or parks as waterbodies can be a vessel for diseases, parks are patronised by citizens from all walks of life,so the centre should not be near them as well. Hence, it has to be built in a region notwithstanding square. The black grids indicate undesirable locations and the white grids indicate ideal locations
Part 4: Analytical Hierarchical Process Input Matrix
Data Source: AHP Template from SCBUK (XLS)
Part 4.1: Analytical Hierarchical Process Result Report
(1) For economic factor, I assigned 1, as the base value.
(2) For accessibility factor, i assigned 3 because it is slightly important.
(3) For health factor, i assigned 5, it is the most important.
(4) For nature factor, i assigned 4, of secondary importance.
The pair-wise comparison matrix and its relative importance to each other factors have been computed. They are 0.076, 0.239,0.381,0.304. These are then used to determine the consistence index (CI).
Consistency index is 0.01398781. Since the number of factors used in the decision making is 4, the corresponding value is 0.9, according to the randomness index scale. This is the randomness index (RI).
The final consistency ratio (CR) is then found by calculating the division of consistency index value and the randomness index value. CR is 0.015542014.
Since CR<=0.1, the consistency score shows that the judging criterias have a reasonable level of consistency.
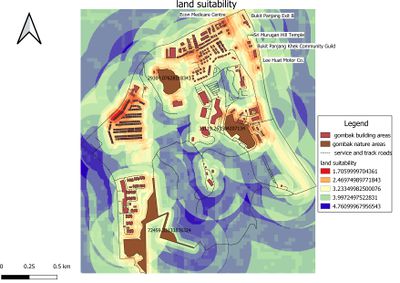
Part 5: Map Layout (Suitability)
