SMT201 AY2019-20G1 EX2 Moh Qing Loong Darren
Contents
Part 1: Map Layout with four views
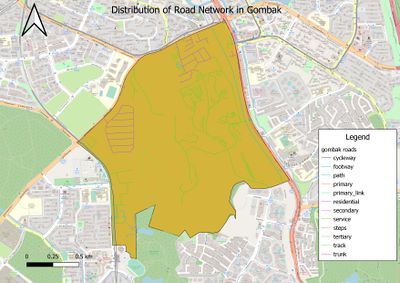
Gombak Road - showing the study area and the target roads
not more than 100 words Description:
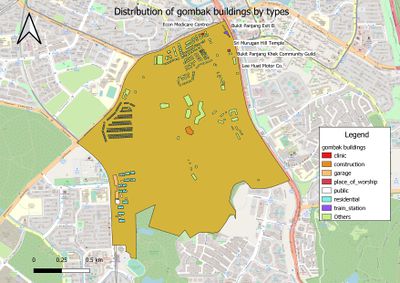
Gombak Buildings - showing the study area and buildings
Description:
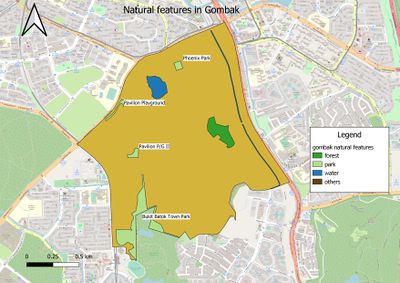
Gombak's natural features - showing the study area and the target natural features
Description:
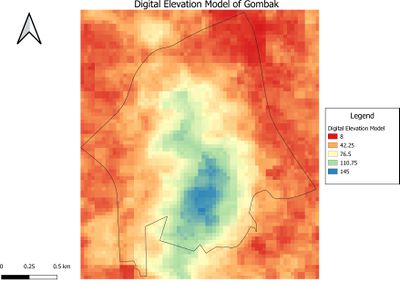
Digital Elevation Model of Gombak - showing the study area and the digital elevation model
Description:
Part 2: Map Layout with four views (Proximity)
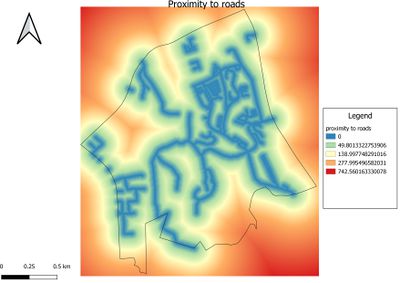
Gombak Road - showing the study area and proximity to target roads
not more than 150 words Description: The legend of Proximity map layer indicates that the furthest distance from the roads is 708.678 metres.
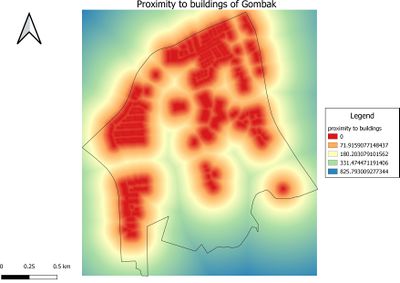
Gombak Buildings - showing the study area and proximity to buildings
Description: The legend of Proximity map layer indicates that the furthest distance from the buildings is 826.62 metres.
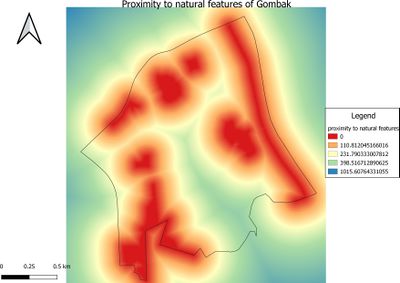
Gombak's natural features - showing the study area and the proximity to target natural features
Description: The legend of Proximity map layer indicates that the furthest distance from the natural features is 1016.62 metres.
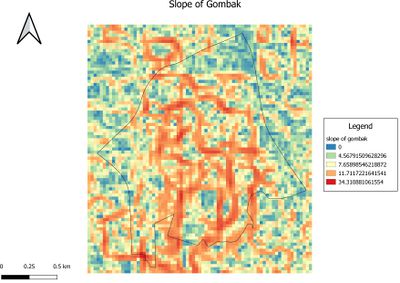
The slope of Gombak - showing the study area and the slope
Description: The legend of Slope layer shows that the minimum and maximum values of the slope values are 0 and 34.3452 degrees respectively. The grids with darker grey indicate locations with relatively gentle slope. On the other hand, the light grey grids indicate locations with steeper slope.
Part 3: May Layout with four views (Criterion Scores)
Description: 1)Economic factor
Economic factor: The selected site should avoid steep slope. This is because construction at steep slope tends to involve a lot of cut-and-fill and will lend to relatively higher development cost.As such, we define steep slopes as those more than 15m. The black grids indicate locations with slope value greater than 15 degrees and white grids indicate locations with slope value less than or equal to 15 degrees.
2) Accessibility Factor
Accessibility factor: The selected site should be close to existing local roads, namely: service roads and tracks. This is to ensure easy transportation of building materials during the construction stage. The estimated ideal distance is less than 201m. The black grids indicate locations with distances greater than 200m and white grids indicate distances less than or equal to 200m. 3) Health Risk Factor
Health risk factor: The selected site should be away from population i.e. housing areas and offices in order to avoid disease spreading to the nearby population. The communicable disease centre will be infectious and hence, it has to be built in a region notwithstanding 10000msquare. The black grids indicate undesirable locations and the white grids indicate ideal locations
4) Natural Conservation Factor
Natural conservation factor: The selected site should be away from forested land, park and water. Since diseases are transmitted by aquatic means, the communicable disease centre should also not be located near waterbodies or parks as waterbodies can be a vessel for diseases, parks are patronised by citizens from all walks of life,so the centre should not be near them as well. Hence, it has to be built in a region notwithstanding square. The black grids indicate undesirable locations and the white grids indicate ideal locations
Part 4: Analytical Hierarchical Process Input Matrix
Part 4.1: Analytical Hierarchical Process Result Report
(1) For economic factor, I have decided to place an importance value of 1.
(2) For accessibility factor, i chose an importance value of 3 because it is slightly important.
(3) For health factor, i place an importance value of 5.
(4) For nature factor, i place an importance value of 4.
The pair-wise comparison matrix and its relative importance to each other factors have been computed. They are 0.076, 0.239,0.381,0.304. These are then used to determine the consistence index (CI).
Consistency index is 0.01398781. Since the number of factors used in the decision making is 4, the corresponding value is 0.9, according to the randomness index scale. This is the randomness index (RI).
The final consistency ratio (CR) is then found by calculating the division of consistency index value and the randomness index value. CR is 0.015542014.
Since CR<=0.1, the consistency score shows that the judging criterias are reasonable.
