Two Eyes One Pizza Data
Contents
Preliminary Data Observations
<What data we have here>
Steps:
- Align to Geometry and Coordinate Reference System for all files: EPSG:3828
- Extracting each POI from the different shp files
- Formation of polygons for each branch to align to ppt slides' trade area
Extracting Competitor's Data Points
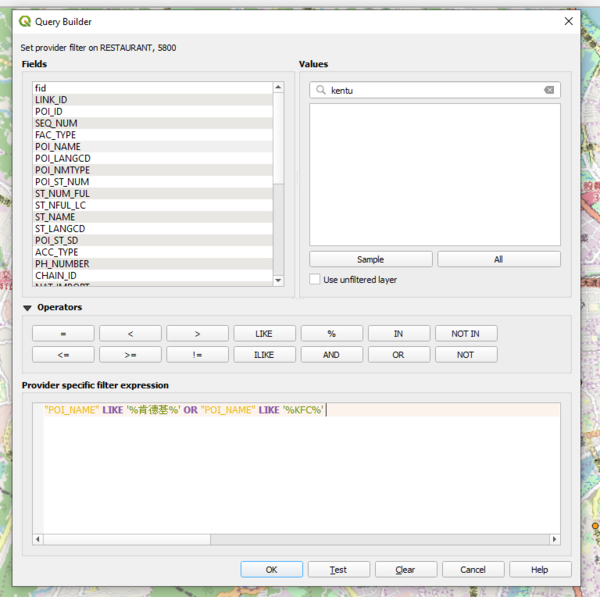
5 Competitors are identified and they are Dominos Pizza, Napolean Pizza, Mcdonalds, KFC and MosBurger. These data points are crucial in our analysis as they may have a correlation with the sales data. Hence, these competitors branches location have to be extracted from "Restaurant 5800".
After extraction, they are exported as layers in the geopackage to be used for aggregation.
Aggregating POIs into each trade area (Script)
It is an exhausting task to aggregating each of the POIs into each trade area using the "Count Points in Polygon" tool.
The batch processing tool was tried but it is unable to append each newly created POI into an existing geopackage. Hence, a python script was written and it ran under QGIS's Python Console. It utilised "processing.run('qgis:countpointsinpolygon', parameters)" function, an inbuilt function by QGIS.
Learn more about the function here: https://docs.qgis.org/2.8/en/docs/user_manual/processing_algs/qgis/vector_analysis_tools/countpointsinpolygon.html
After the aggregation of POIs into each trade area, below is the screenshot of the columns for a particular trade area.
Polygon
Comments
Feel free to leave comments / suggestions!


