SMT201 AY2019-20G2 Ex1 Ng Qi Hui
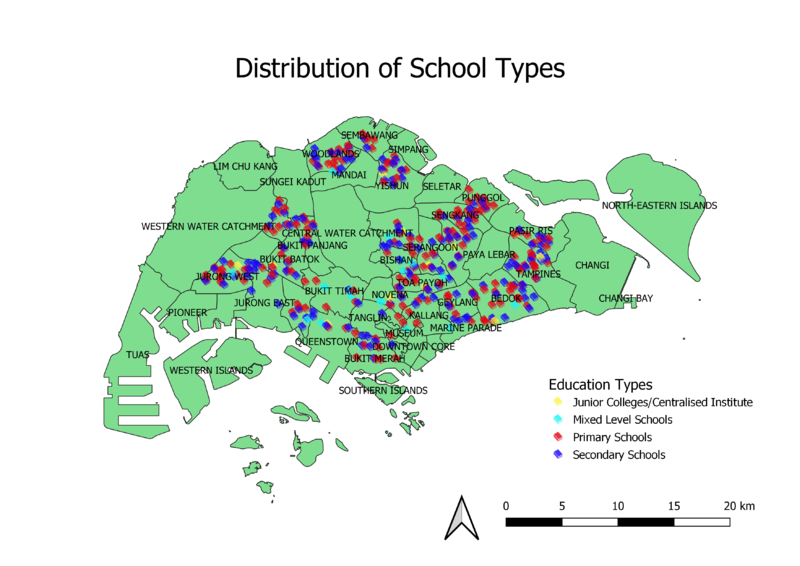
Distribution of School Types
The school types are qualitative data with nominal scales, so I categorized the data in POI_CHAR from the attribute table. I made use of the SVG symbols to symbolize schools. Following that, by assigning a different color to every school type, I could show the distribution of the type of schools throughout Singapore. For better identification purposes, I added the planning area of Singapore and included their labels so that the user can know at a glance where are the different types of schools located at.
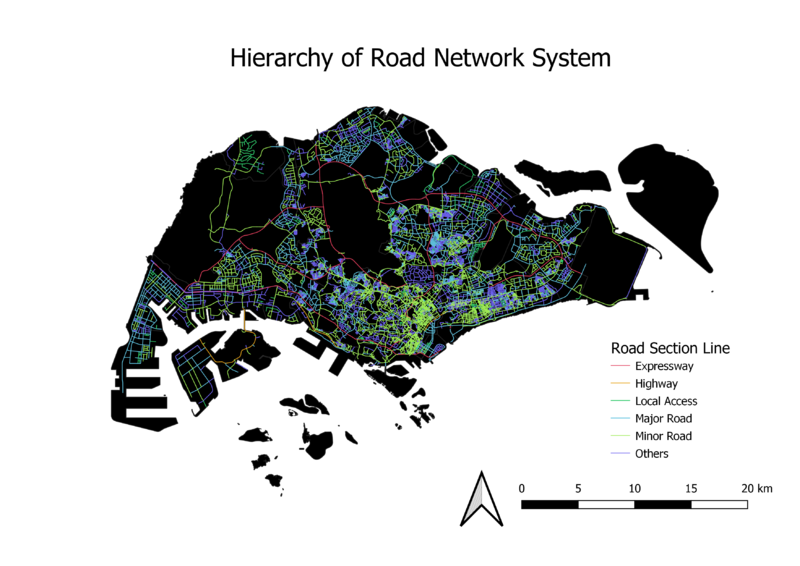
Hierarchy of Road Network System
Since the types of roads in the network system is a form of qualitative data with nominal scales, I chose to categorize the roads. There were too many roads from the network system data initially which resulted in a very messy road network . Hence, I decided to categorize the roads into 6 big categories: Expressways, Highways, Local Access (walk, lane, link), Major Roads (boulevard, avenue, drive), Minor Roads (road, street), and Others. I created a new column RD_CLASS and filtered out the different roads into their various types. Then I opened field calculator to input the corresponding category type to the roads. Each category was assigned a different color for clearer illustration of the composition of the road network system.
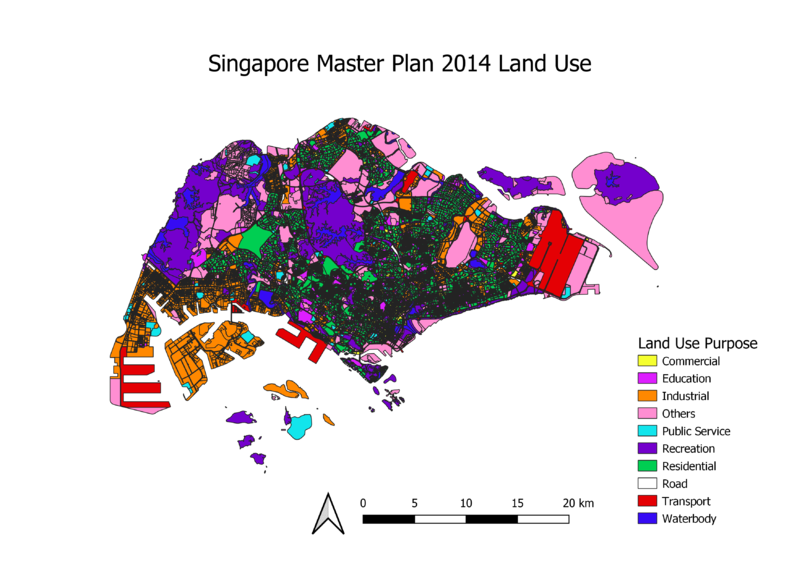
Singapore Master Plan 2014 Land Use
The land use features are qualitative data, so I used the data in LU_Desc from the attribute table to categorize the various land uses. Since there were too many separate land uses throughout Singapore which resulted in a very complicated map, I decided to merge some land uses which are common together into a larger group category. For instance, I grouped business 1 and business 2 together as ‘Industrial’. A different color was assigned to every land use category so that the user can identify how much of Singapore’s land is being used for that particular purpose.


