SMT201 AY2019-20T1 EX1 Ong Krystal
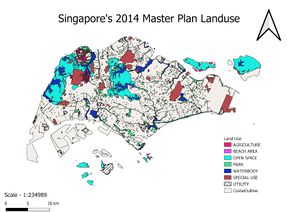
Categorised grouping is chosen as it is used to group according to description of the purpose of the piece of land. There are many sub groups and by using different colour to classify each description makes it easier for visualisation.
However, due to the large number of purposes for land use, I chose to arrange the map that is closer to the most recent master plan that focuses on planning for inclusive, sustainable and green neighbourhoods. Areas that is less significant to this goal was removed from this map so that it would be easier for viewers to identify the land use that can help promote a more sustainable and green neighbourhood. Land use such as park, open spaces, waterbody were included to be used to promote sustainability in the country.


