SMT201 AY2018-19T1 EX1 Lim Jia Khee
Part One: Thematic Mapping
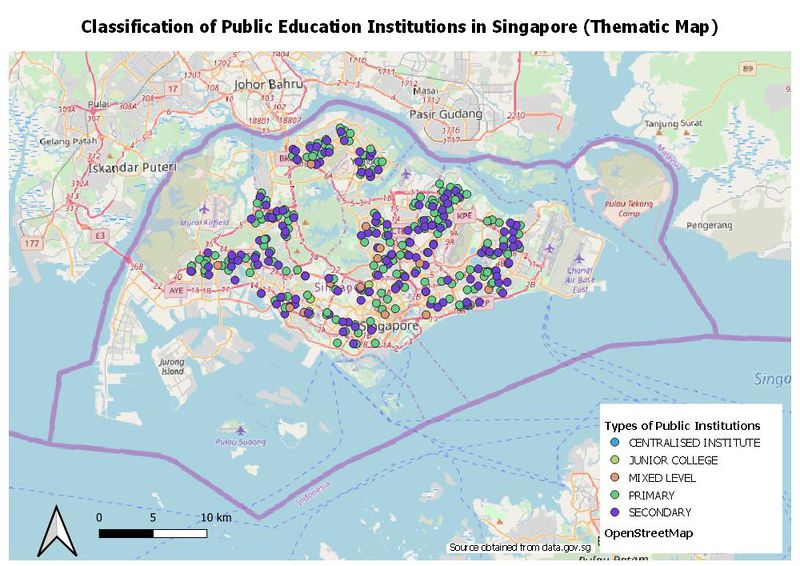
Distribution of Public Education Institutions in Singapore
My classification choice for this map is through the Categorized " approach, using 'mainlevel_' as the classification variable. I have chosen to differentiate the different classes through colour differentiation, with a fixed symbol size. I did not manipulate the categories within the chosen variable as the fields within the column were already well sorted out with no missing variables. I included an Open Street Map as the background for this will provide a macro understanding of the distribution of the various institution types in a quick glance.
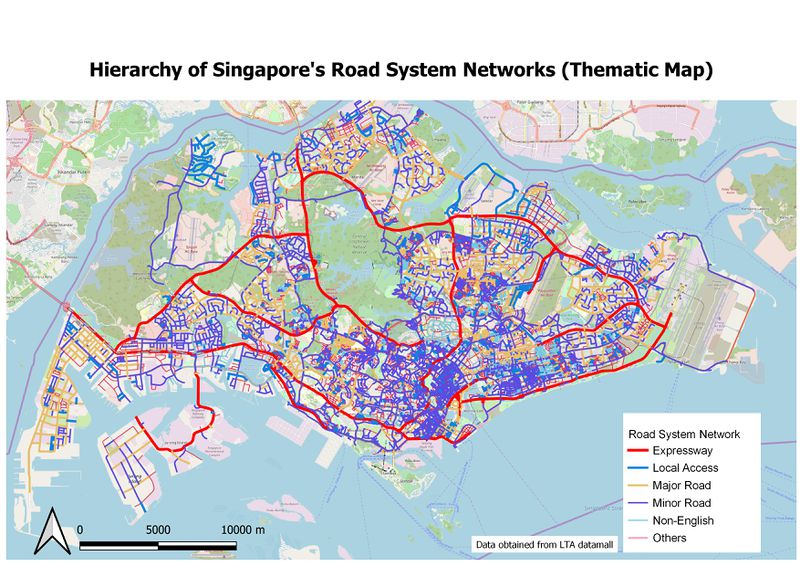
Hierarchy of Road Network System in Singapore
In the raw 'Road Section Line' dataset downloaded off data.gov, there was an absence in categorisation for road names. Using an article (link in reference [5]), I sorted Singapore's road names into five major categories. I then used the 'Categorization' approach, with my newly created variable to plot. I differentiated the different categories through colour and width of road types - with Expressway type of roads being the thickest and 'Others' road types being the thinnest. Also, I assigned brighter colours to Expressway, Major Road types such that it will be more obvious to the reader at one glance.
2014 Master Plan Landuse
In plotting this polygon qualitative thematic map, the variable I used for classification is “Lu_Desc”. I did not reduce the number of categories when plotting for three reasons. One, “Lu_Desc” is a categorical not numerical variable. Unlike numerical variables, there is no need to consider about distribution. Secondly, there are no missing values within the “Lu_Desc” variable. Lastly, without understanding the context behind each category, it is very difficult to merge/concise some categories without losing the meaning behind every individual category.
Part Two: Choropleth Mapping
Singapore's Aged Population (65+) in 2010 and 2017
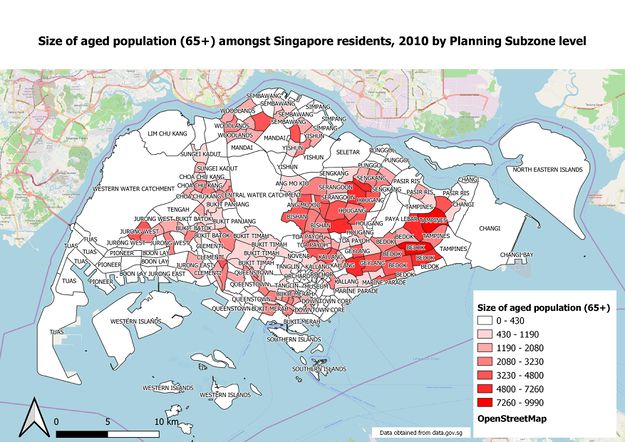
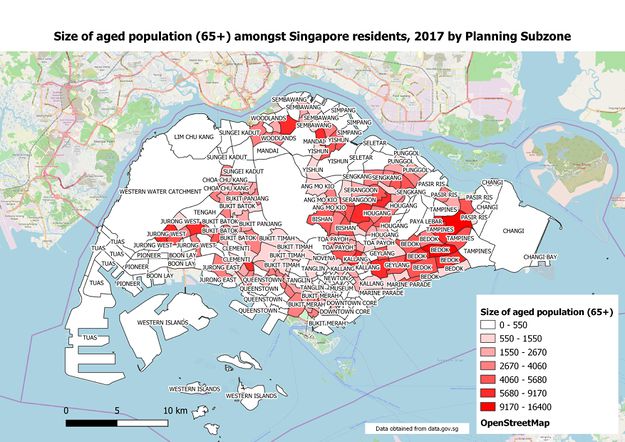
The 2010 and 2017 choropleth maps for count of Singapore's aged population appears to have very similar spatial patterns, with the highest number of elderly population (65+) found in Tampines, Bedok, Serangoon and Bishan new towns. One observation made from both maps is that the number of elderly populations across all new towns have increased. Residents in Singapore appear to be living till an older age.
Proportion of Singapore's Aged Population (65+) in 2010 and 2017
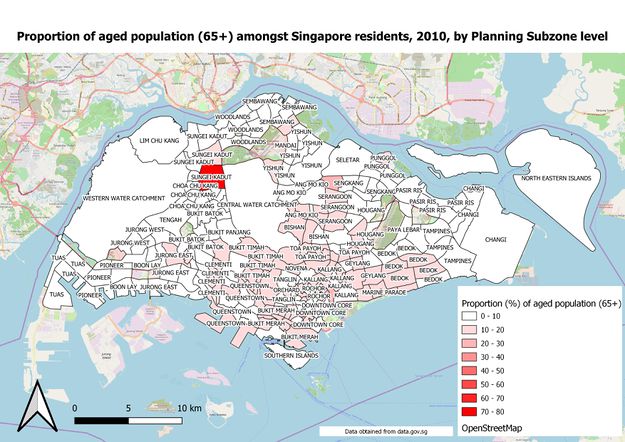
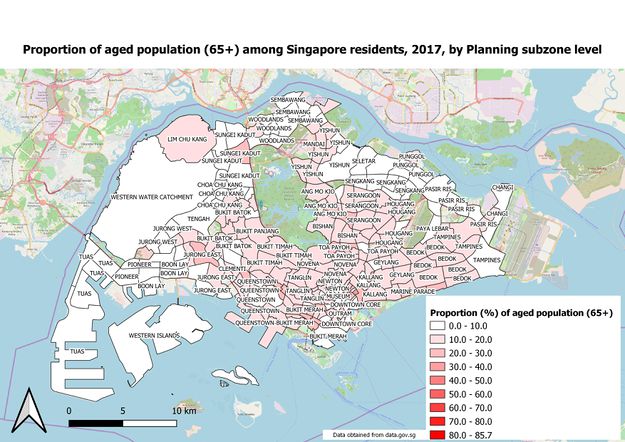
The 2010 and 2017 Proportion of Singapore’s aged population choropleth maps tell a very different story from the choropleth maps above. As identified from above, the new towns with a large number of elderly population (Bishan, Serangoon, Tampines and Bedok) have relatively low/healthy proportions of elderly population. This is expected as these new towns are also larger in size. On the other hand, it is shocking to learn of an outlier – Sungei Kadut. There is a subzone within Sungei Kadut that has an elderly population of 80%. In the 2017 Proportion of Singapore’s Aged Population map, this outlier appears to have disappeared. One possibility could be relocation of elderly population by the government, for it is not healthy to have elderly population highly concentrated in one area.
Percentage Change of Aged Population From 2010 to 2017
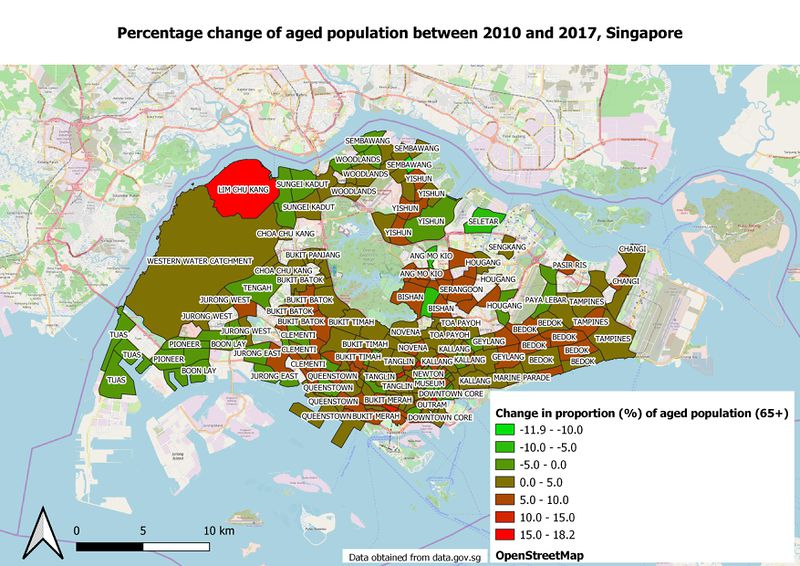
The subzones with green shade indicates that there is a reduction in proportion of elderly from 2010 to 2017, while the subzones in red indicate of the opposite. It appears that the movement of elderly population in Singapore is of spatial randomness. This hypothesis is not confirmed until further tests are done. One interesting observation is that the Lim Chu Kang subzone has the biggest increase in proportion of elderly population (18.17% increase) over the seven years.
Reasoning behind classification choices, new derived variables, missing values and assumptions
I decided to work with Singapore's Age Population (65+) for years 2010 and 2017 as there were no other data sets on data.gov that is related to Singapore's residents by age group and gender, year 2018. The next best alternative is Singapore's residents by age group and gender in year 2017 data set. Also, the dataset was only available in .kml extension as there were no other files available for .shp or .csv extensions. I made an assumption that the population data from 2017 will have major similarities with 2018's population data, hence ensure that my analysis is relevant.
In handling the 2017 Singapore's residents by age group and gender .kml file, it was necessary to change all age-related columns from string type to double type. To do so, Refactor fields tool was used. However, there were 9 rows that I did not manage to change convert it to double type. The error was due to "ring self-intersection" of the polygons. Due to the lack of technical expertise, I decided to omit the 9 subzones from the analysis. Instead of having 323 subzones for the 2017 map, I only had 314 to work with. I had no problems working with the 2010 Singapore's residents by age group and gender data set as the required fields for aggregation were already in double variable types.
For the count of aged population, both 2010 and 2017 choropleth maps, the classification method used was 'Natural Jenks'. This method was chosen as the data was heavily right-skewed and it appears that there are many groups within the histogram chart. Hence, this method will help to reduce the inter-group standard deviation while maximise the intra-group standard deviation. It appears that 7 is the best number of bins.
For the proportion of aged population, both 2010 and 2017 choropleth maps, the classification method used was 'Pretty Breaks'. I believed that this was the best method given that we were working with percentage markers. Being able to divide our classes into "clean" percentage ranges makes it easiest for any end-user to understand at one glance.
References and data sources
1. https://www.data.gov.sg/search?q=school+information
2. https://www.data.gov.sg/dataset/master-plan-2014-land-use
3. https://www.data.gov.sg/dataset/master-plan-2014-subzone-boundary-no-sea
4. https://www.data.gov.sg/dataset/master-plan-2008-subzone-boundary-no-sea
5. https://www.remembersingapore.org/2018/08/15/singapore-street-suffixes/
6. SMT201 elearn - Week 4 Hands on Ex 4 - Coastal Outline Shapefiles from SLA
7. https://www.mytransport.sg/content/mytransport/home/dataMall/search_datasets.html?searchText=road - Road Section Line
8. https://www.data.gov.sg/dataset/singapore-residents-by-subzone-age-group-and-sex-jun-2017-gender
9. https://www.data.gov.sg/dataset/singapore-residents-by-subzone-age-group-and-sex-june-2010-gender
