File:School-distribution.png
Revision as of 21:32, 15 September 2019 by Kaelyn.kong.2018 (talk | contribs)
Size of this preview: 800 × 566 pixels. Other resolutions: 320 × 226 pixels | 3,507 × 2,480 pixels.
Original file (3,507 × 2,480 pixels, file size: 1.1 MB, MIME type: image/png)
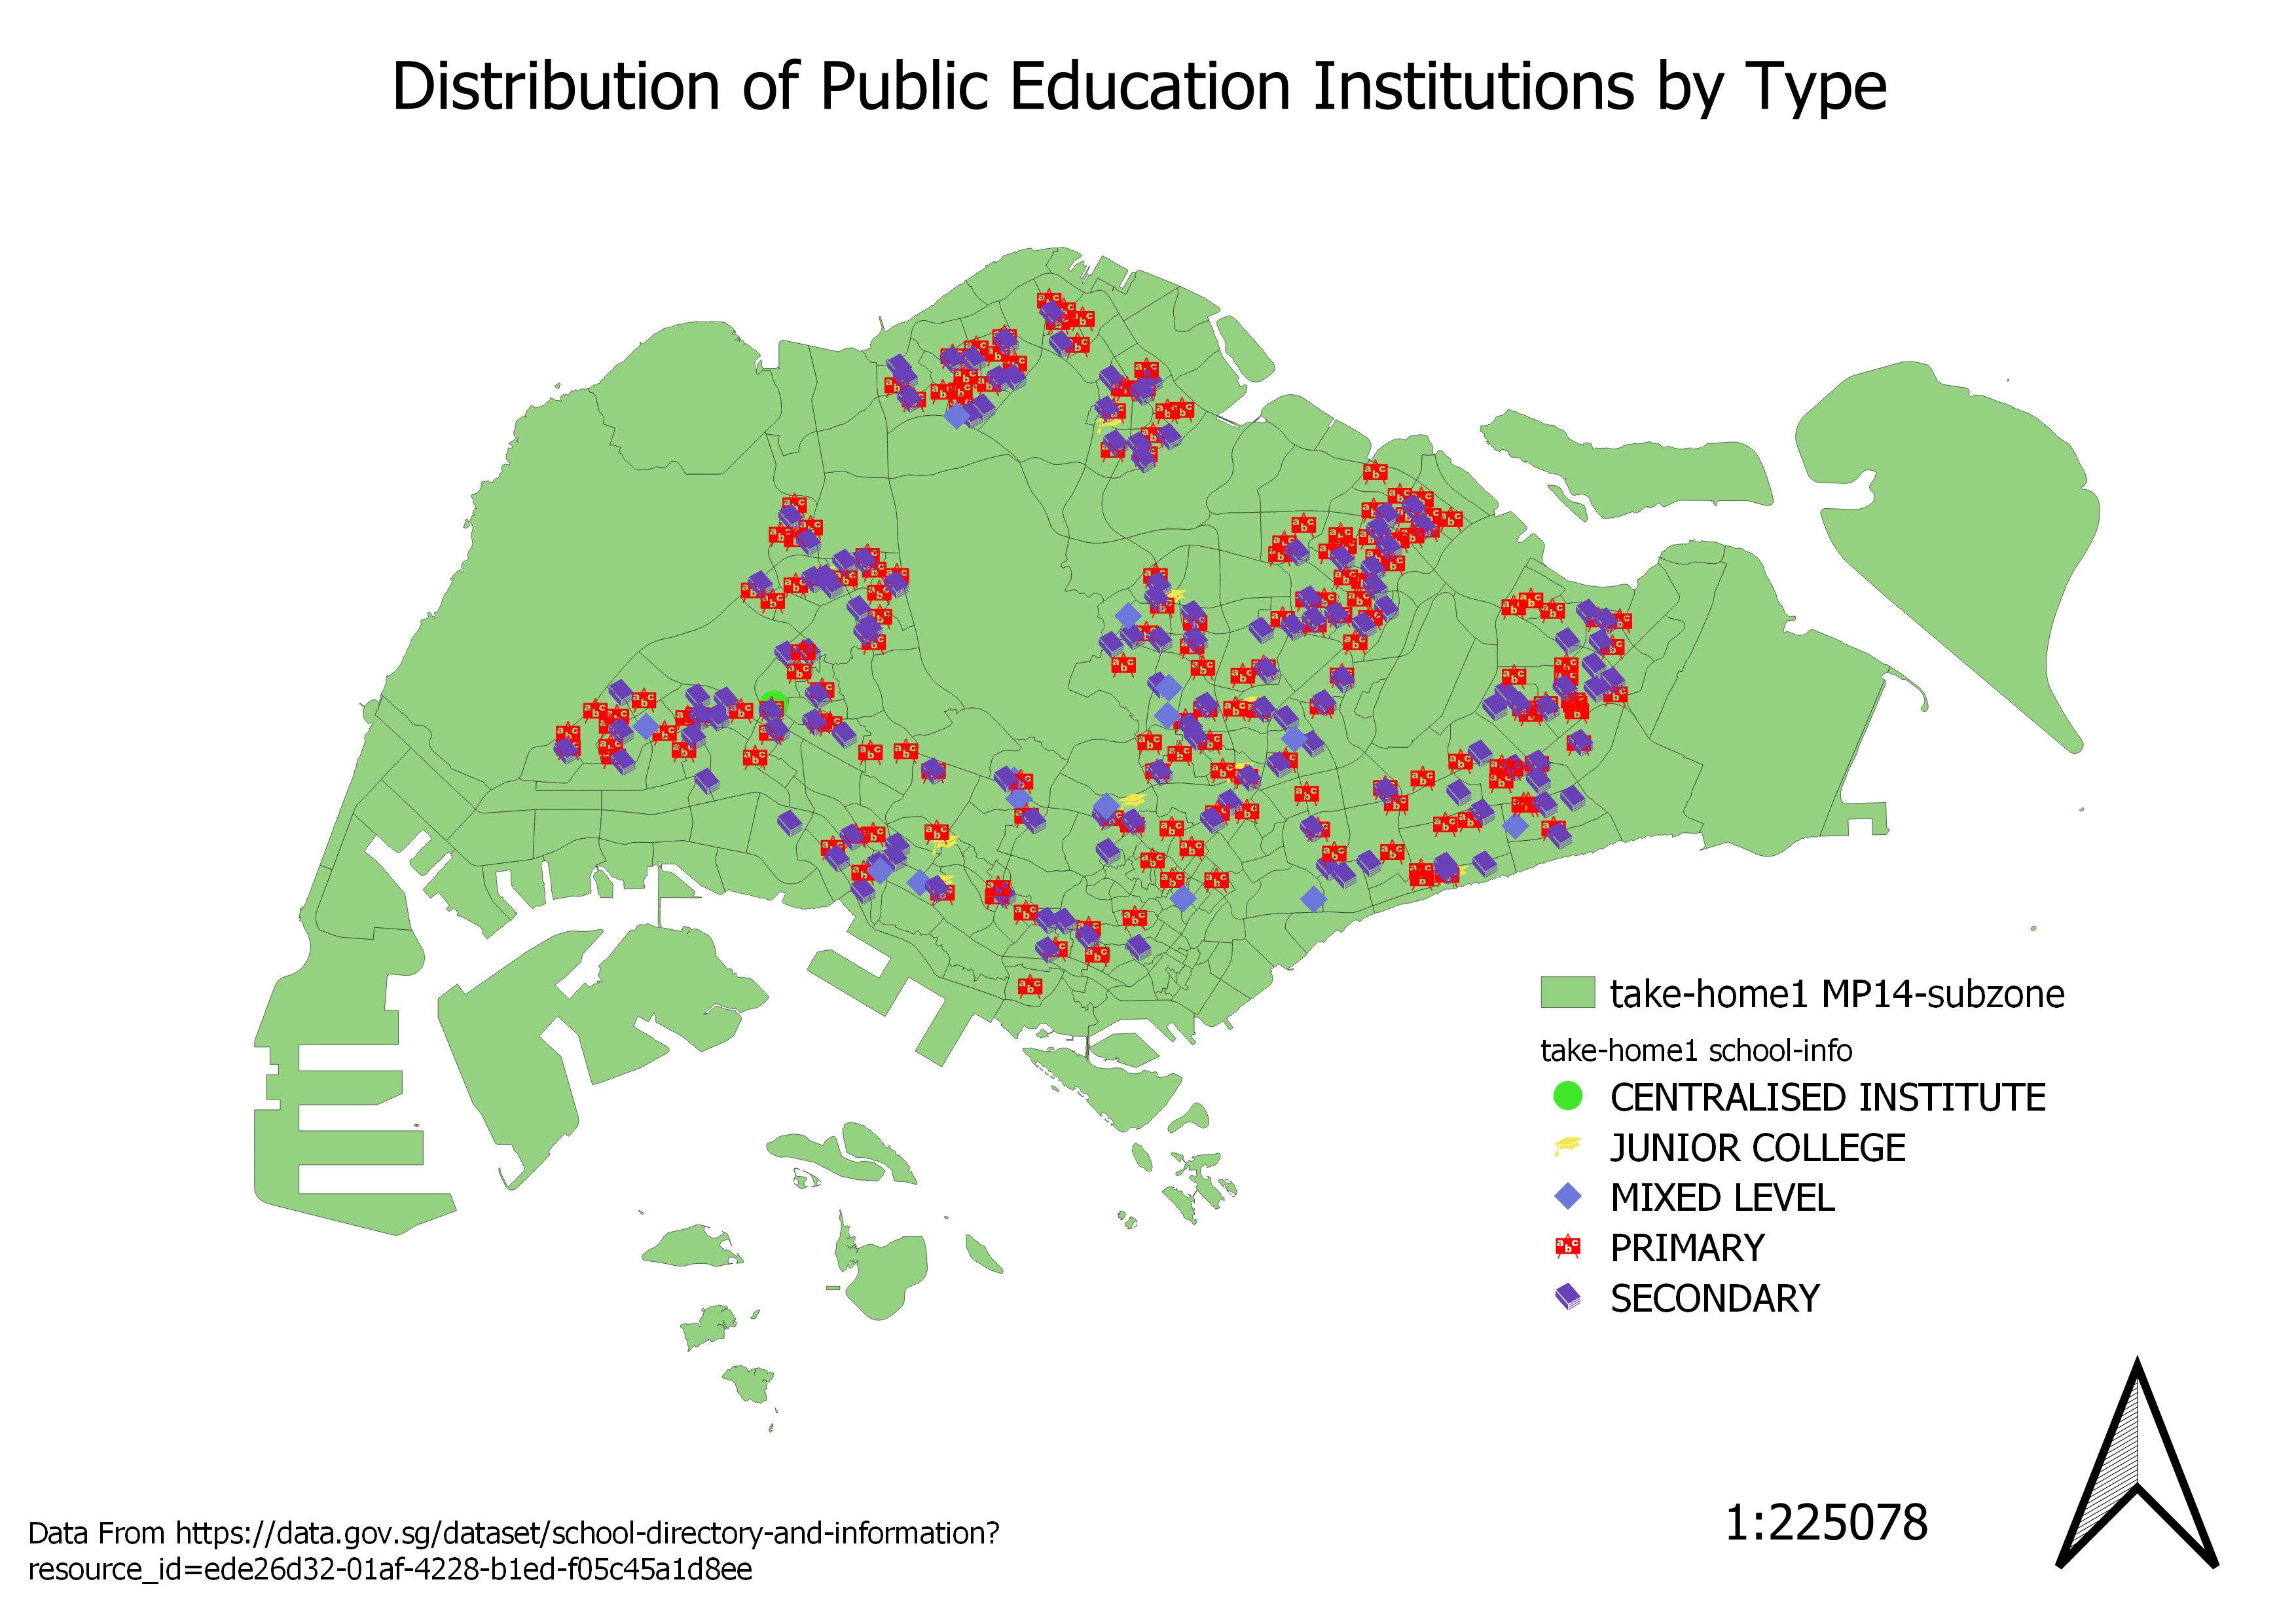
To show the distribution of public education institutions, I firstly classified the schools into the different Public Institution Types, namely “Primary School”, “Secondary School”, “Junior College”, “Mixed Level” and “Centralised Institute”. Different categorical markers and symbols were used to differentiate between the different school types, namely primary, secondary, mixed level and junior college. One marker was used for each type, for better visual representation of the distribution.
File history
Click on a date/time to view the file as it appeared at that time.
| Date/Time | Thumbnail | Dimensions | User | Comment | |
|---|---|---|---|---|---|
| current | 21:32, 15 September 2019 | | 3,507 × 2,480 (1.1 MB) | Kaelyn.kong.2018 (talk | contribs) |
- You cannot overwrite this file.
File usage
There are no pages that use this file.