SMT201 AY2019-20T1 EX1 Tan Wei Long Ryan
Contents
- 1 Part One: Thematic Mapping
- 2 Part Two: Choropleth Mapping
- 2.1 Singapore's Aged Population (65+) in 2010
- 2.2 Singapore's Aged Population (65+) in 2018
- 2.3 Proportion of Singapore's Aged Population in 2010
- 2.4 Proportion of Singapore's Aged Population in 2018
- 2.5 Percentage Change of Aged Population From 2010 to 2018
- 2.6 Reasoning behind classification choices
- 3 References and data sources
Part One: Thematic Mapping
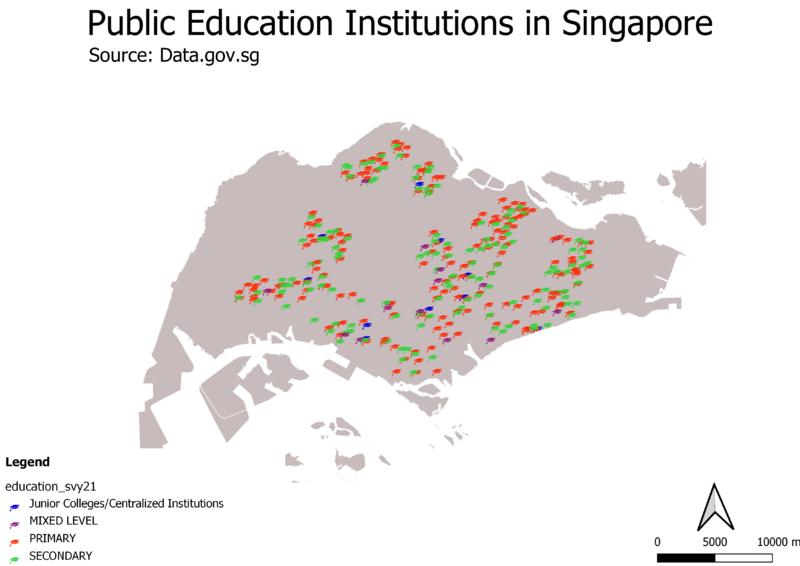
Distribution of Public Education Institutions in Singapore
The map shown is a qualitative thematic map with point symbols.
The different public education institutions are symbolized by classifying them based on the institution’s education level, namely Junior College/Centralized Institutions, Mixed Level, Primary and Secondary and plotted on the coastal outline of Singapore.
A light grey fill is chosen for the coastal outline which allows the symbols on the map to stand out with their respective colours, allowing readers to easily see the distribution of the schools across the island.
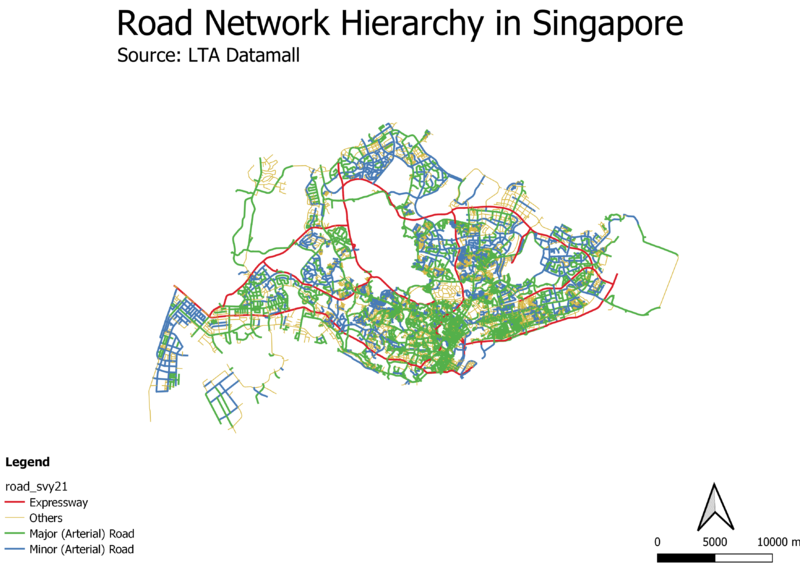
Hierarchy of Road Network System in Singapore
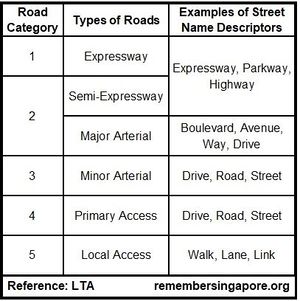
The map shown is a qualitative thematic map of lines. According to a reference from LTA (refer to Fig. 1), there are 5 different categories of roads in Singapore, which can be inferred from the suffixes of their names. For example, Expressways will be named with Expressway, Parkway or Highway.
An attribute, Road_Type was added into the attribute table of the layer, allowing each road to be classified based on its road type.
The different roads were plotted with contrasting coloured lines to allow users to visualize the hierarchy of the road network system easily.
2014 Master Plan Landuse
The map shown is a qualitative thematic map of areas.
The areas were classified based on their land use description, however due to having over 32 categories, similar categories were grouped under one colour on the map, such as purple for businesses and blue for water bodies and beach areas as having 32 different colours would make it difficult for the readers to identify features at glance.
Readers can see the types of categories that have been grouped together on the legend, preserving the original land use description provided in the master plan.
Part Two: Choropleth Mapping
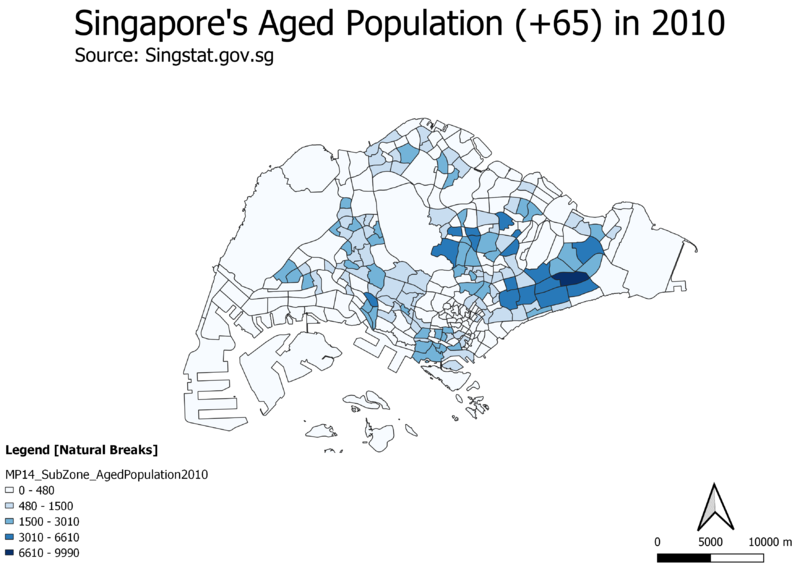
Singapore's Aged Population (65+) in 2010
xxxxx
Singapore's Aged Population (65+) in 2018
xxx
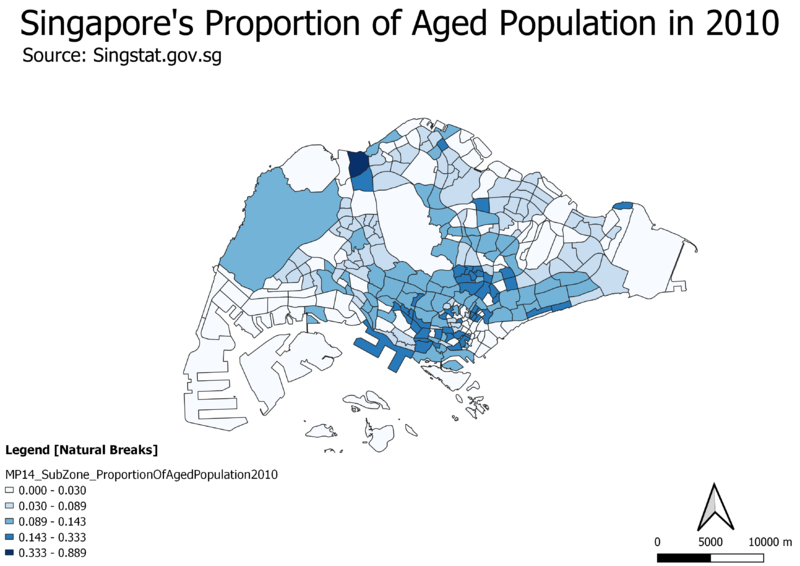
Proportion of Singapore's Aged Population in 2010
123
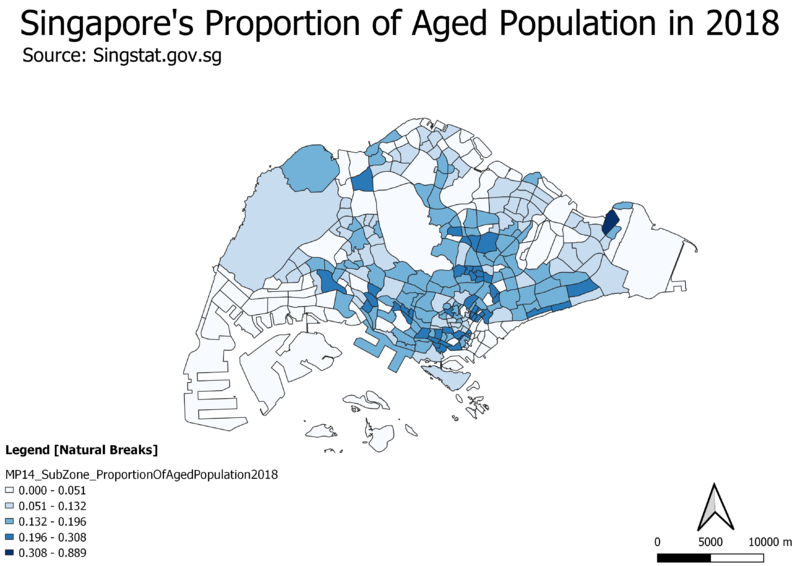
Proportion of Singapore's Aged Population in 2018
123213
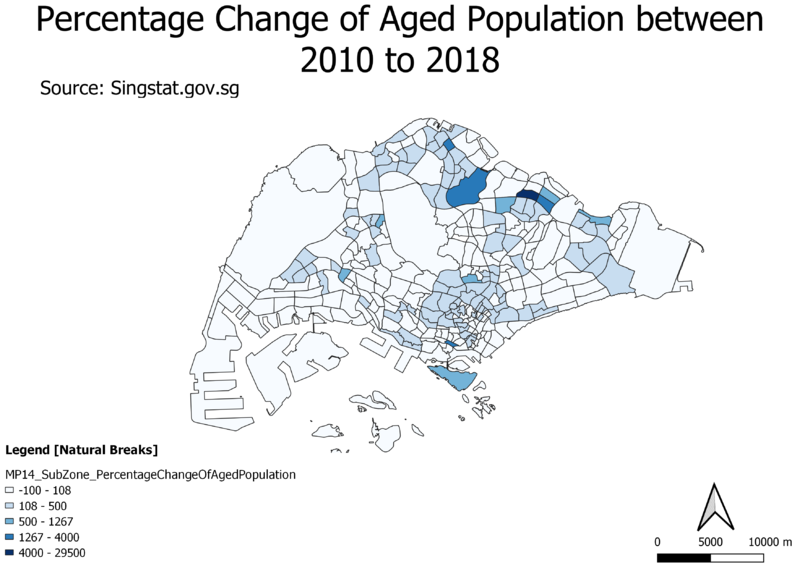
Percentage Change of Aged Population From 2010 to 2018
123213
Reasoning behind classification choices
123321
References and data sources
1. https://www.data.gov.sg/search?q=school+information
2. https://www.data.gov.sg/dataset/master-plan-2014-land-use
3. https://www.data.gov.sg/dataset/master-plan-2014-subzone-boundary-no-sea
4. https://www.lta.gov.sg/content/ltaweb/en/industry-matters/sale-of-plans-and-information/road-line-plan/road-line-plan-explanatory-notes.html
5. https://remembersingapore.org/2018/08/15/singapore-street-suffixes/
6. SMT201 elearn - Week 4 Hands on Ex 4 - Coastal Outline Shapefiles from SLA
7. https://www.mytransport.sg/content/mytransport/home/dataMall/search_datasets.html?searchText=road - Road Selection Line
