SMT201 AY2019-20G1 Ex1 Kning Kit Siang
Part 1: Thematic Mapping
- Using school information from data.gov.sg, prepare a thematic map showing the distribution of public education institution by school types such as primary, secondary, etc.
To prepare a thematic map showing the distribution of public education institution, a comma-separated values (CSV) file, containing the data of the education institution, has been used with MMQGIS in order to geocode the data in the file into a geospatial layer which can be interpreted by QGIS 3.8. The projection system used is SVY21/Singapore TM EPSG:3414 as the data analysed is located in the area of Singapore. Furthermore, a categorized technique has been used as a classification method because the different types of schools which are public education institution of Singapore have qualitative characteristics and can be distinguished by categorizing them. Different symbols, which mostly are related to education, have been used as well to represent the different types of schools to display the locations of the education institution on the digital map and show which region would most of the education institution located in.
- Using road GIS data of LTA, prepare a thematic map showing the hierarchy of road network system of Singapore such as expressway, major road, minor road, etc.
The road network system of Singapore consists of expressways, major roads and minor roads. A new class, known as RD_CLASS, has been added to the attribute table of the RoadSectionLine layer as a representation of the feature of each road, whether each road is an expressway, a major road or a minor road. This helps in categorizing each road on the digital map clearly on the different roads which have been constructed in every region of Singapore. Different colours have been used as well to easily distinguished the feature of each road on the digital map which provides better visualisation of the hierarchy of road network system of Singapore.
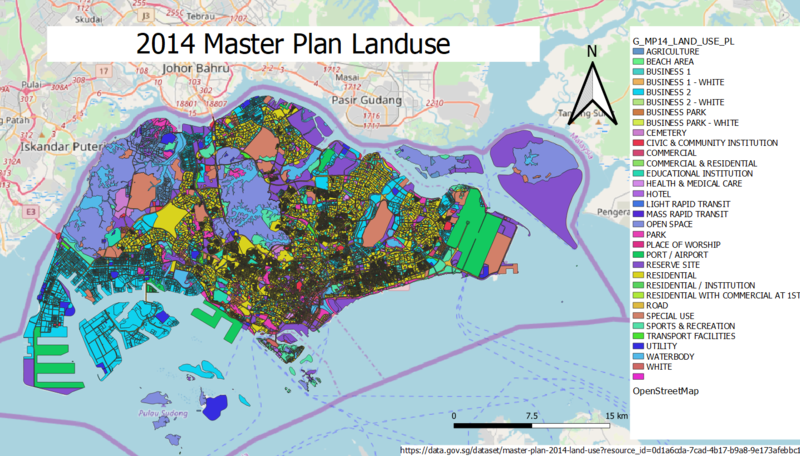
- Using master plan landuse GIS data from data.gov.sg, prepare a thematic map showing 2014 Master Plan Landuse.
A 2014 Master Plan Landuse shapefile has been used to create a thematic map showing 2014 Master Plan Landuse of Singapore. This shapefile is compatible with QGIS 3.8 which helps with the mapping of the landuse of Singapore for various purposes and the development of the country. As every area of the land has been used for its own purpose, these areas can be distinguished easily and classified by using the categorized technique. By using the categorized technique, different colours have been used distinctively to represent every uses and facility which are allocated on different region of Singapore. This helps to give a clear visualisation of what purpose which every part of the land in Singapore has been used for.
Part 2: Choropleth Mapping
- Using planning subzone GIS data from data.gov.sg and Singapore residents by age group and gender, prepare the following choropleth maps:
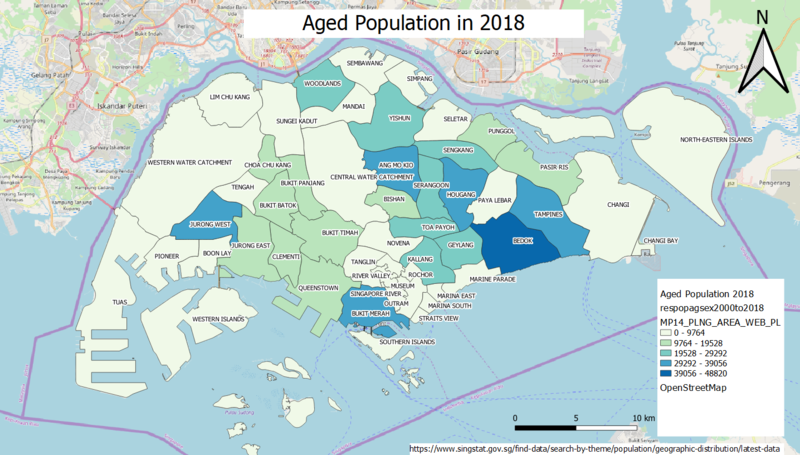
- Aged population (+65) in 2010 and 2018.
[[File: Aged Population of Singapore in 2010 .png|center|800px]]
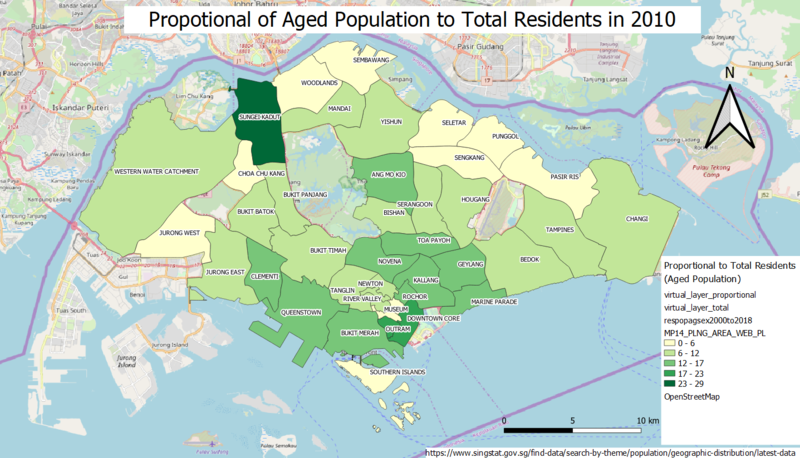
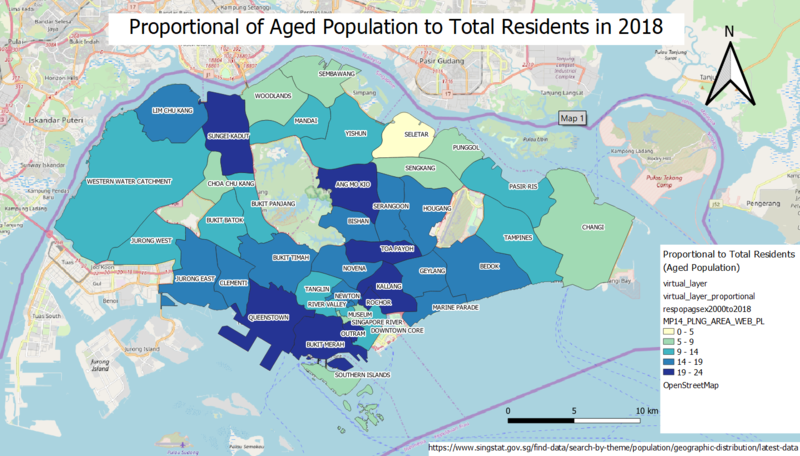
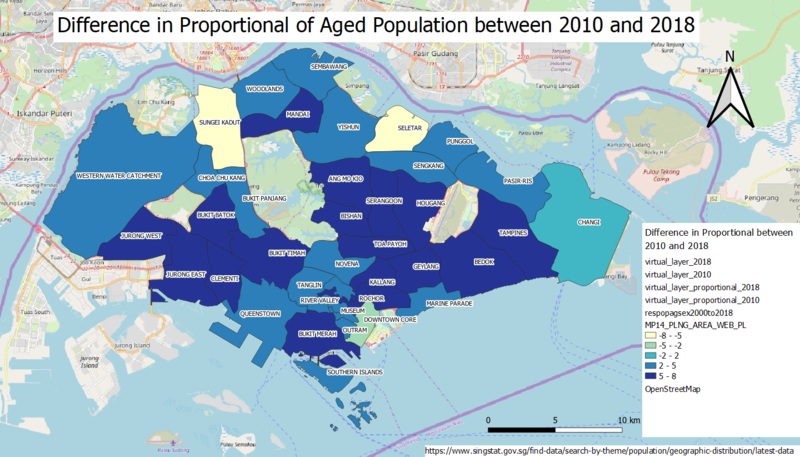
- Proportional of aged population in 2010 and 2018.
- Percentage change of aged population between 2010 and 2018.


