SMT201 AY2019-20G2 Ex1 Jerome Quah Wei Ren
Contents
- 1 PART I: Thematic Mapping
- 2 PART II: Choropleth Mapping
PART I: Thematic Mapping
Map 1: Distribution of Public Education Institutions in Singapore
Description
For this map, the data points were further classified and designed according to their type or main level, namely Centralised Institute, Mixed Level School, Junior College, Secondary School and Primary School, allowing the map viewer to differentiate the different public education institutions around Singapore.
The 2014 Planning Subzone Regions were also used to signify the regions of Singapore, allowing the viewer to further view these institutions in their appropriate regions. The OpenStreetMap layer was inserted to further pinpoint the location of the institutions in terms of different transport modes that can be taken to reach them, nearby amenities etc.
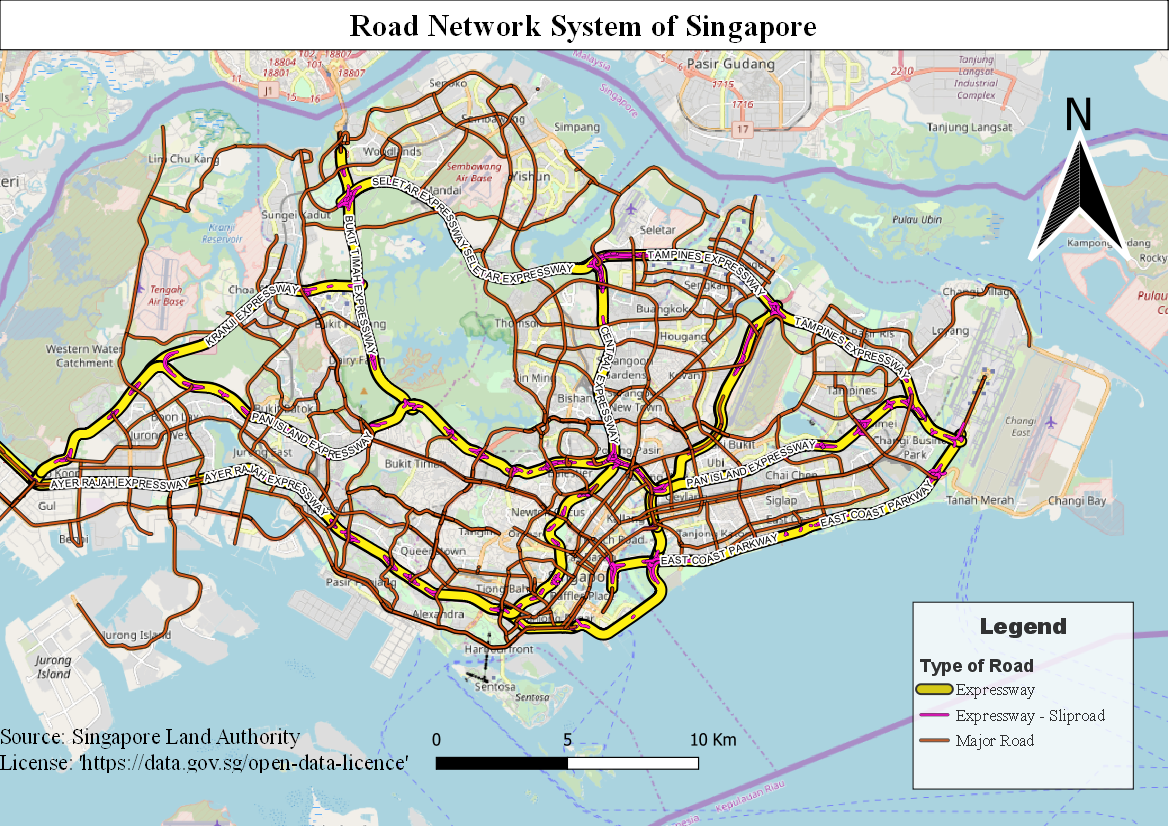
Map 2: Road Network System of Singapore
Description
The data points were further classified and designed according to their type and symbol description, namely Expressway, Expressway-Sliproad and Major Roads. Contour lines were removed due to its inapplicability and the international boundary was replaced using the OpenStreetMap layer that also represents this. The expressways were labelled accordingly to their name, allowing the map viewer to view these expressways at a glance.
With the function of Rule-based labelling, the major roads were also labelled accordingly with a minimum scale of 1:100000, allowing the viewer to zoom in and identify these roads which can be connected to the expressways via sliproads.
Map 3: 2014 Master Plan Landuse
Description
The areas were narrowed down to the following which I feel are relevant in this map. The OpenStreetMap layer was also added for the map viewer to easily identify these areas.
With the land scarcity of Singapore, this map was designed to emphasise the open spaces of Singapore that could be utilised for further developments. The special/reserved areas designate the areas which are unavailable to be utilised. With Singapore being a major transhipment hub relying on exports from foreign countries, waterbodies and agriculture are also highlighted in this map where these areas could be substituted for other purposes.
PART II: Choropleth Mapping
Background Information
For the following maps, the term ‘Aged Population’ refers to Singaporean residents who are at least 65 years of age.
The 2014 Planning Subzone GIS data and the 2008 Planning Subzone GIS data by the Urban Redevelopment Authority were utilized for the maps portraying the related population in 2010 and 2018 respectively. This is to cater for the difference in the subzone areas between 2014 and 2008, in which the subzones that are present in the 2014 Planning Subzone GIS Data might not be present in the 2008 Planning Subzone GIS data, leading to data discrepancies and unaccounted values.
For instance:
2008 Planning Subzone GIS data: Subzone_Code AMSZ08 is YIO CHU KANG
2014 Planning Subzone GIS data: Subzone_Code AMSZ08 is TAGORE. YIO CHU KANG is AMSZ10 instead.
Map 4: Aged Population in 2010
Spacial Patterns/Reveals
From the map, the aged population of Singapore tends to be clustered in the East Region. From the East Region the subzones of Tampines East, Bedok North, Bedok South and Trafalgar seem to have the highest concentration of the aged population
Reasoning
With the intention of adding a Delimited Text Layer from the CSV. File that contains the integer values, I first started out with ‘cleaning’ the data, in the sense that all the empty cells and cells with ‘-’ are changed to 0. This is to ensure the prevent of any NULL values when the layer is added to QGIS. The layout of the CSV. File was also referenced from the ‘AgeGroup2017’ CSV.File used on HandsOnEx4.
From this, the new field of ‘Age 65+’ was derived through the following expression:
"AgeGroup2010_AGE65-69" + "AgeGroup2010_AGE70-74" + "AgeGroup2010_AGE75-79" + "AgeGroup2010_AGE80-84" + "AgeGroup2010_AGE85"
From this, the Graduated Symbology function was used with the column of ‘Age65+’. The Natural Breaks (Jenks) Mode was used to classify this column, allowing the creation of the choropleth map with the accurate representation of the trends or classes in the aged population.
After which, the Rule-based labelling function was used to identify the names of the subzones that fall within the 4th or 5th classes of the symbology, allowing the map viewer to recognise the areas that have high aged population in Singapore. The following expression was used:
"Age65+" >= 3230
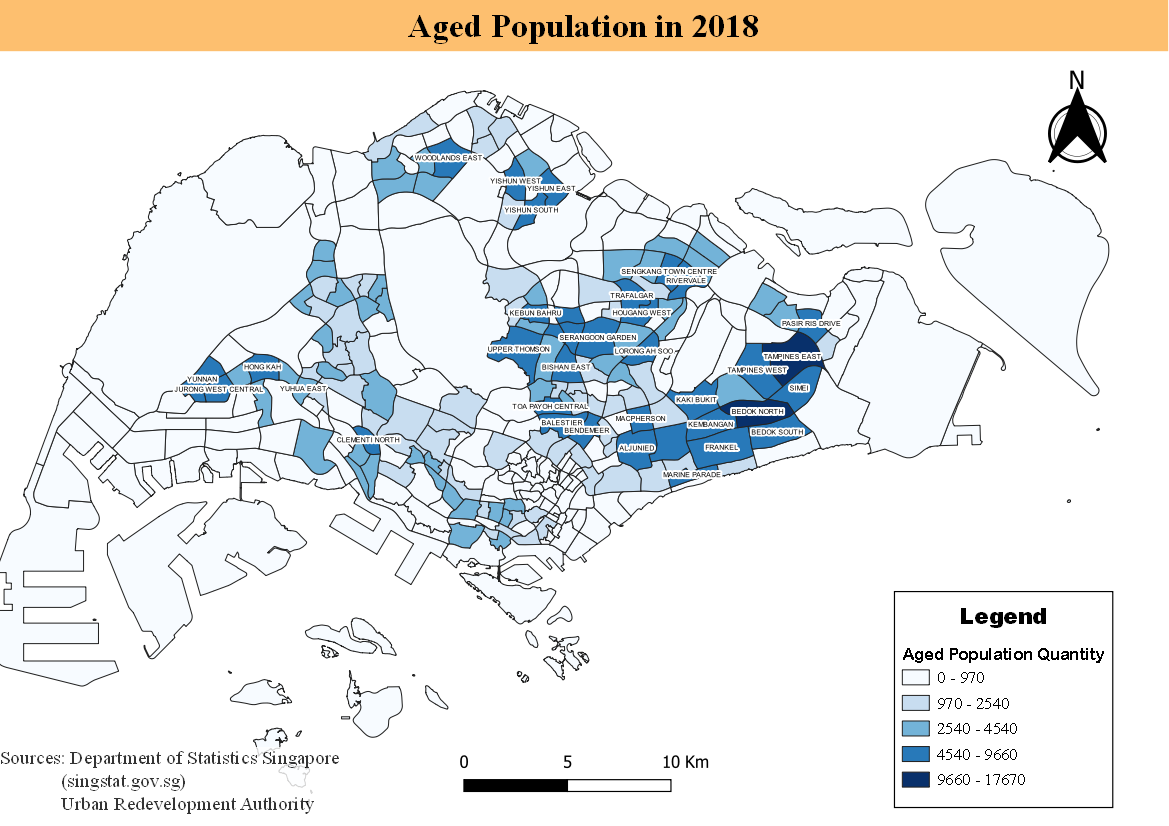
Map 5: Aged Population in 2018
Spacial Patterns/Reveals
Similarly to Map 4, the aged population of Singapore tends to be clustered in the East Region. However, there are fewer subzones that have a particularly high concentration of aged population, namely Tampines East and Bedok North.
From Map 4 and Map 5, there seems to be an increase in the quantity of the Aged Population in Singapore. This can be seen from the Classes used in these Maps. For example, the 4th class of Map 4 starts at a value of 3230, while the very same class of Map 5 starts at 4540.
Reasoning
With the intention of adding a Delimited Text Layer from the CSV. File that contains the integer values, I first started out with ‘cleaning’ the data, in the sense that all the empty cells and cells with ‘-’ are changed to 0. This is to ensure the prevent of any NULL values when the layer is added to QGIS. The layout of the CSV. File was also referenced from the ‘AgeGroup2017’ CSV.File used on HandsOnEx4.
From this, the new field of ‘Age 65+’ was derived through the following expression:
"AgeGroup2018_AGE65-69" + "AgeGroup2018_AGE70-74" + "AgeGroup2018_AGE75-79" + "AgeGroup2018_AGE80-84" + "AgeGroup2018_AGE85"
From this, the Graduated Symbology function was used with the column of ‘Age65+’. The Natural Breaks (Jenks) Mode was used to classify this column, allowing the creation of the choropleth map with the accurate representation of the trends or classes in the aged population.
After which, the Rule-based labelling function was used to identify the names of the subzones that fall within the 4th or 5th classes of the symbology, allowing the map viewer to recognise the areas that have high aged population in Singapore. The following expression was used:
"Age65 +" >= 4540
Map 6: Proportion of Aged Population in 2010
Spacial Patterns/Reveals
After calculating the proportions, the subzones that consist of a large aged population tends to cluster in the Central Zone of Singapore. Some examples of these subzones are Telok Blangah Drive, Alexandra Hill and Farrer Court. Jalan Kayu West seems to have the highest proportion of aged residents in Singapore.
Reasoning
Following the steps carried out in Maps 4 and 5, calculating the proportion of Aged Population in Singapore would require one more field which would be the ‘AgeTotal’. This new field was derived from the following expression:
"AgeGroup2010_AGE0-4" + "AgeGroup2010_AGE5-9" + "AgeGroup2010_AGE10-14" + "AgeGroup2010_AGE15-19" + "AgeGroup2010_AGE20-24" + "AgeGroup2010_AGE25-29" + "AgeGroup2010_AGE30-34" + "AgeGroup2010_AGE35-39" + "AgeGroup2010_AGE40-44" + "AgeGroup2010_AGE45-49" + "AgeGroup2010_AGE50-54" + "AgeGroup2010_AGE55-59" + "AgeGroup2010_AGE60-64" + "AgeGroup2010_AGE65-69" + "AgeGroup2010_AGE70-74" + "AgeGroup2010_AGE75-79" + "AgeGroup2010_AGE80-84" + "AgeGroup2010_AGE85"
After the calculation of this field, a new field named ‘ProportionAged’ was derived using the following expression:
“Age65+” / “AgeTotal”
However, after calculating, this field consisted of NULL values as there are cases in which the subzones do not have any integer values. An example would be PLSZ04 – AIRPORT ROAD. Therefore, the NULL values would be derived from a Zero Division Error when the ‘ProportionAged’ expression was used (0/0). I mitigated around this by manually changing the NULL values to 0 by using the Toggle Editing Mode in the Attribute Table.
From this, the Graduated Symbology function was used with the column of ‘ProportionAged’. The Natural Breaks (Jenks) Mode was used to classify this column, allowing the creation of the choropleth map with the accurate representation of the trends or classes in the aged population.
After which, the Rule-based labelling function was used to identify the names of the subzones that fall within the 4th or 5th classes of the symbology, allowing the map viewer to recognise the areas that have a high proportion of aged residents in Singapore. The following expression was used:
"ProportionAged" >= 0.143
Map 7: Proportion of Aged Population in 2018
Spacial Patterns/Reveals
After calculating the proportions, the subzones that consist of a large aged population tends to cluster in the Central and East Zones of Singapore. Some examples of these subzones are Marine Parade, Commonwealth, Siglap, Bedok South and Bugis. For this map, Loyang West seems to have the highest proportion of aged residents in Singapore.
In contrast to Map 6, there seems to be more subzones that have a high proportions of aged residents in Singapore, where there are more subzones in 2018 that fall within the 4th class of the symbology as compared to Map 6. Furthermore, this map also indicates that there is a rising aging population in Singapore, with the values of the symbology classes being higher than that of Map 6.
Reasoning
Following the steps carried out in Maps 4 and 5, calculating the proportion of Aged Population in Singapore would require one more field which would be the ‘AgeTotal’. This new field was derived from the following expression:
"AgeGroup2018_AGE0-4" + "AgeGroup2018_AGE5-9" + "AgeGroup2018_AGE10-14" + "AgeGroup2018_AGE15-19" + "AgeGroup2018_AGE20-24" + "AgeGroup2018_AGE25-29" + "AgeGroup2018_AGE30-34" + "AgeGroup2018_AGE35-39" + "AgeGroup2018_AGE40-44" + "AgeGroup2018_AGE45-49" + "AgeGroup2018_AGE50-54" + "AgeGroup2018_AGE55-59" + "AgeGroup2018_AGE60-64" + "AgeGroup2018_AGE65-69" + "AgeGroup2018_AGE70-74" + "AgeGroup2018_AGE75-79" + "AgeGroup2018_AGE80-84" + "AgeGroup2018_AGE85"
After the calculation of this field, a new field named ‘ProportionAged’ was derived using the following expression:
“Age65 +” / “AgeTotal”
However, after calculating, this field consisted of NULL values as there are cases in which the subzones do not have any integer values. An example would be TSSZ04 – TUAS BAY. Therefore, the NULL values would be derived from a Zero Division Error when the ‘ProportionAged’ expression was used (0/0). I mitigated around this by manually changing the NULL values to 0 by using the Toggle Editing Mode in the Attribute Table.
From this, the Graduated Symbology function was used with the column of ‘ProportionAged’. The Natural Breaks (Jenks) Mode was used to classify this column, allowing the creation of the choropleth map with the accurate representation of the trends or classes in the aged population.
After which, the Rule-based labelling function was used to identify the names of the subzones that fall within the 4th or 5th classes of the symbology, allowing the map viewer to recognise the areas that have a high proportion of aged residents in Singapore. The following expression was used:
"ProportionAged" >= 0.196


