SMT201 AY2019-20T1 EX1 Ho Wei Jie Clint
Contents
Part 1: Thematic Mapping
Map 1: School Type
- Using school information from data.gov.sg, prepare a thematic map showing the distribution of public education institution by school types such as primary, secondary, etc
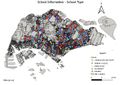
Type of schools

The map shows the different type of schools in Singapore, namely – Centralized Institute, Junior College, Mixed Level, Secondary and Primary, where these schools are plotted on top of the masterplan landuse 2014 layer. There are in total of 344 schools. Each different school type is assigned a unique symbol and color to differentiate them. Also, the color of the map (masterplan landuse 2014) was given a neutral color (grey) to make it easier to identify the different colors of the respective type of schools. The source of the layers – schools and masterplan landuse 2014, was taken from data.gov.sg.
Map 2: Road Network System
- Using road GIS data of LTA, prepare a thematic map showing the hierarchy of road network system of Singapore such as expressway, major road, minor road, etc

Type of Roads

The map shows the hierarchy of Singapore’s road network system, namely three tiers – Expressway, Major Roads and Minor Roads, where these roads are plotted on top of the masterplan landuse 2014 layer. Each road type is designated a unique color and stroke width to distinguish between the different types of roads. Also, the color of the map (masterplan landuse 2014) was assigned a neutral and brighter color (light yellow) which makes it easier to identify the respective road types through contrast of colors. The source of the layers – roads and masterplan landuse 2014, was taken from data.gov.sg.
Map 3: Master Plan Landuse
- Using master plan landuse GIS data from data.gov.sg, prepare a thematic map showing 2014 Master Plan Landuse.
The map shows a map of the 2014 masterplan landuse from data.gov.sg. The map is categorised into different types of landuse (32 types) where each type of landuse is assigned a unique color, as shown in the legend, which demarcates the landuse area. The use of different colors also makes it easier to identify the different types of landuse.
Part 2: Choropleth Mapping
Using planning subzone GIS data from data.gov.sg and Singapore residents by age group and gender, prepare the following choropleth maps:
- Aged population (+65) in 2010 and 2018.
- Proportional of aged population in 2010 and 2018.
- Percentage change of aged population between 2010 and 2018