SMT201 AY2019-20T1 EX1 Lee Shanzhen Leandra Faith
Part 1: Thematic Mapping
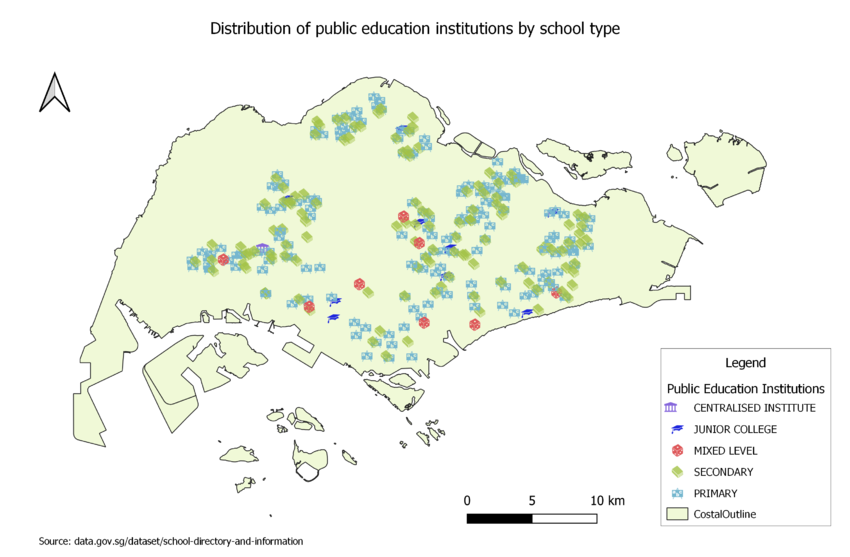
a) Using school information from data.gov.sg, prepare a thematic map showing the distribution of public education institution by school types such as primary, secondary, etc.
I have chosen to symbolise the different education categories using point symbols from the SVG vector symbol set, as it is easy to recognise the type of school from these symbols. This is an appropriate classification method for displaying the data given that the data on school type is qualitative and can be grouped into 5 discrete classes.
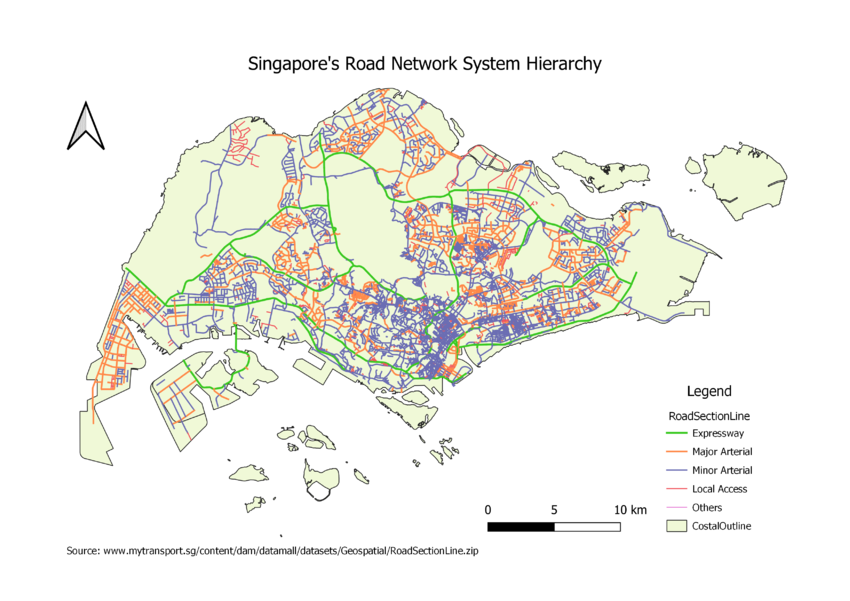
b) Using road GIS data of LTA, prepare a thematic map showing the hierarchy of road network system of Singapore such as expressway, major road, minor road, etc.
Based on Guidelines on the Naming of Streets published by Urban Redevelopment Authority, I split the road network system in Singapore into 5 classes. Since the roads were represented using lines(polylines) in QGIS, I symbolised the different lines using different colours and widths. Expressways had the thickest width, followed by Major Arterial, Minor Arterial, Local Access and Others.
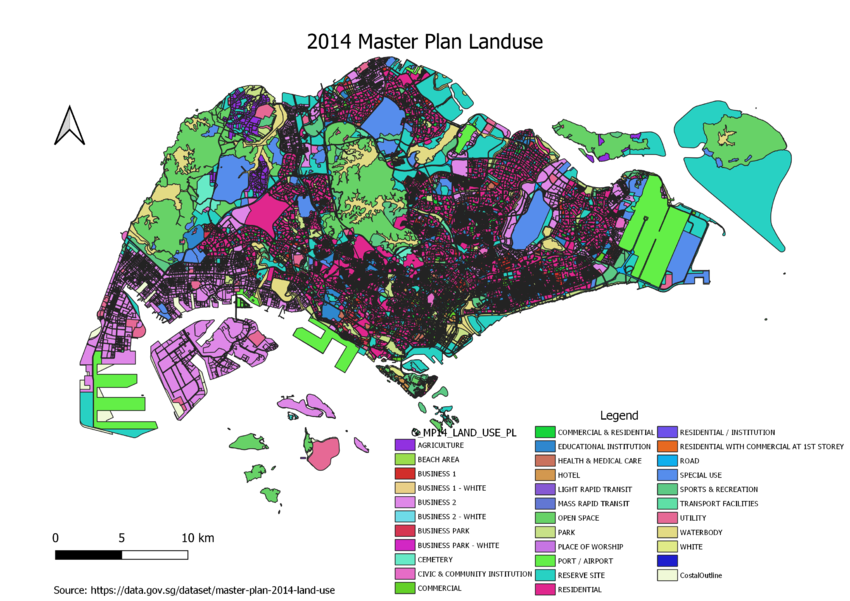
c) Using master plan landuse GIS data from data.gov.sg, prepare a thematic map showing 2014 Master Plan Landuse.
As the land use data (LU_DESC) is qualitative and can be split into discrete classes, I chose to use different colours for polygons representing different land-use types. This makes sense because the colour will fill the area of the polygon, and we can refer to the legend to identify what the plot of land is used for.
Part 2: Choropleth Mapping
a) Aged Population in 2010
b) Aged Population in 2018


